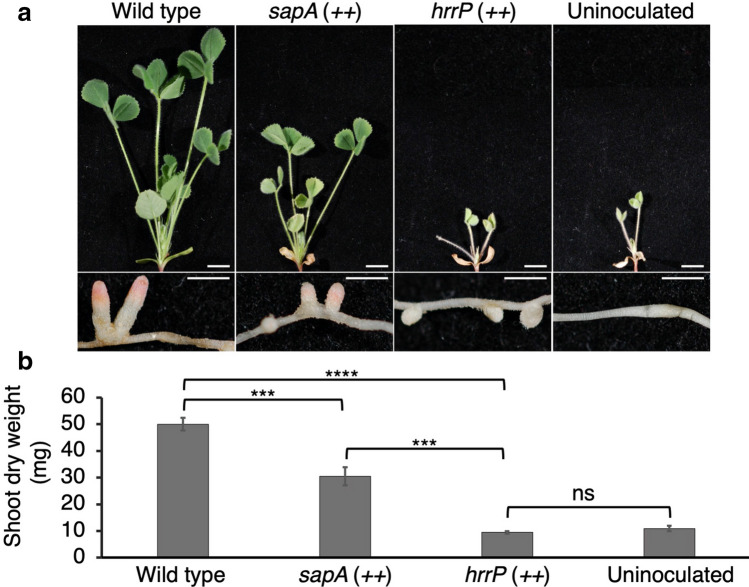
Figure 1.
Effects of over-expressing peptidases on plant fitness. (a) Representative plants and nodules from each condition were harvested 28 dpi. Scale bars in shoot and nodule pictures are 1 cm and 0.25 cm, respectively. (b) Shoot dry mass was determined using the average masses of 12 plants of each condition harvested 28 dpi. For statistical analysis, a one-way ANOVA with a post-hoc Dunnett’s T3 test was performed. Significance levels are indicated (ns = not significant, ***P < 0.001, ****P < 0.0001). Standard error of the mean is represented in each bar.

