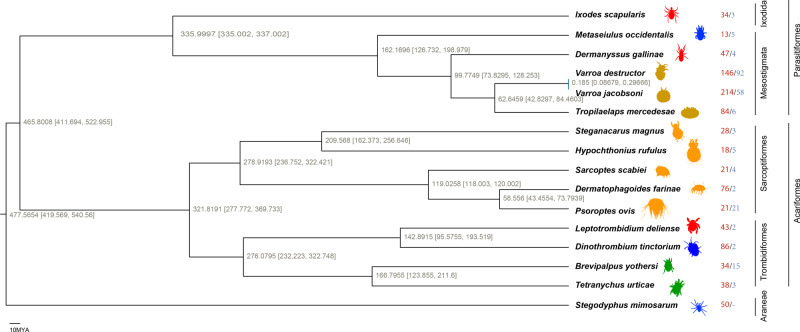
Fig. 1. The genome-wide phylogenetic tree of Arachnida.
The divergence time was estimated based on a maximum likelihood phylogenomic tree of 16 Arachnida species and three fossil calibrations. All nodes have 100% support according to 1,000 bootstraps. The estimated divergence times are displayed with 95% confidence intervals (in square brackets). Blood-sucking species in red; fat-feeding species in olive; herbivorous species in green; predatory species in blue; and others/transitional in orange. The same colour theme is used in the other figures. The numbers to the right of the species indicate the records of gene family expansions and contractions, with red for expansions and blue for contractions.

