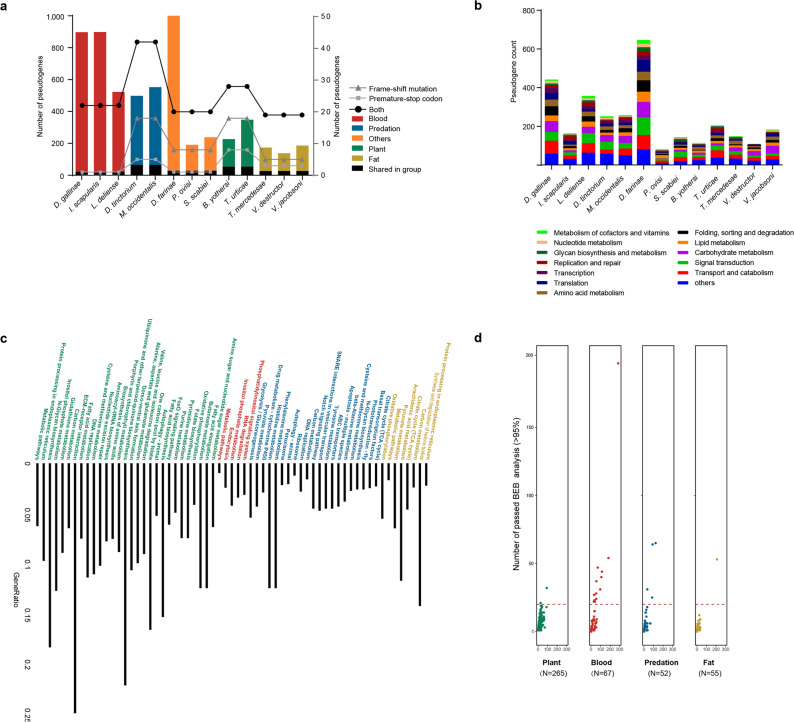
Fig. 2. Pseudogene and PSG profiles of different dietary groups.
a The overall numbers of pseudogenes detected in each group are shown in different colours reference to left y-axis, and the numbers of shared pseudogenes in each group are shown in black. The pseudogenes in each group are divided into three types, namely, frame-shift mutation, premature-stop codon, and both, and the ratios of types are displayed by lines reference to right y-axis. b The functional classification of the pseudogenes in each group. c KEGG enrichment analysis of the PSGs. d PSGs generated by the orthologous genes annotated in at least two species in each dietary group. The number in parentheses represents the number of PSGs in the group. The dot plot shows the numbers of positively selected sites across four different dietary groups. The x-axis indicates the number of loci detected as being under selection pressure, and the y-axis indicates the number of positively selected loci with a BEB posterior probability greater than 95% in PAML. PSG positively selected gene, KEGG Kyoto Encyclopedia of Genes and Genomes, BEB Bayesian empirical Bayes.

