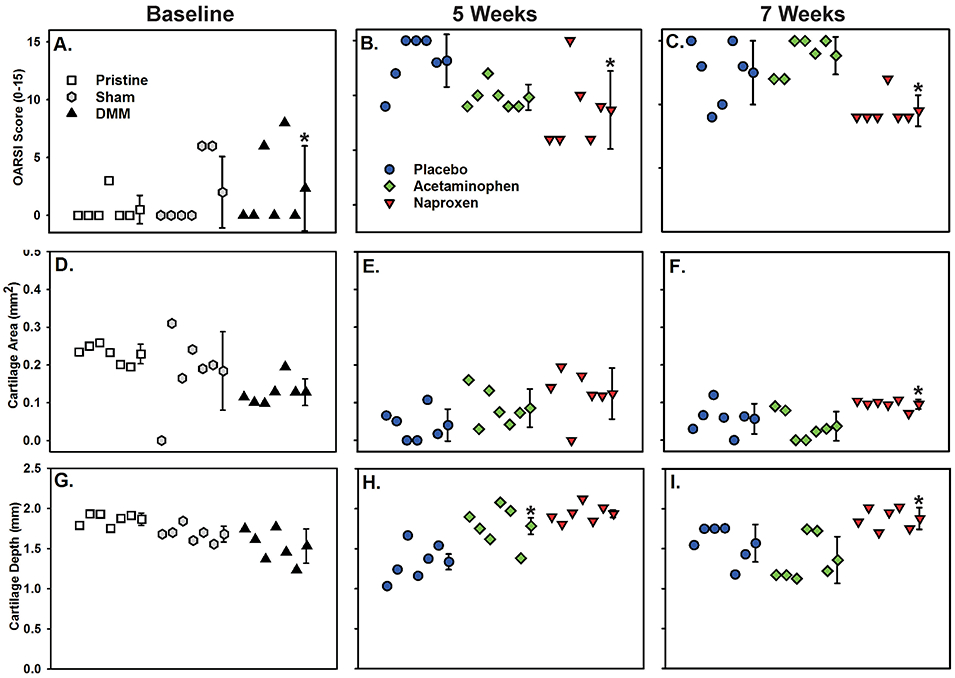
Figure 2.

Quantitative analysis of tibia articular cartilage. Plots detail OARSI scoring, cartilage area, and cartilage depth measurements taken from the medial aspect of tibias following DMM surgery at baseline (A, D, G), 5 weeks (B, E, H), and 7 weeks (C, F, I) after surgery (n=6 per group). Mean and standard deviation are shown after individual samples for each group. The Symbol legends are shown in panels A and B. Values significantly different than the pristine (panels A) or placebo control (panels B, C, F, and H) are indicated (*). Cartilage depth was also significantly greater in the 7 week naproxen group as compared to the acetaminophen group (panel I, *). See Tables S-2 and S-3 for numerical values.
