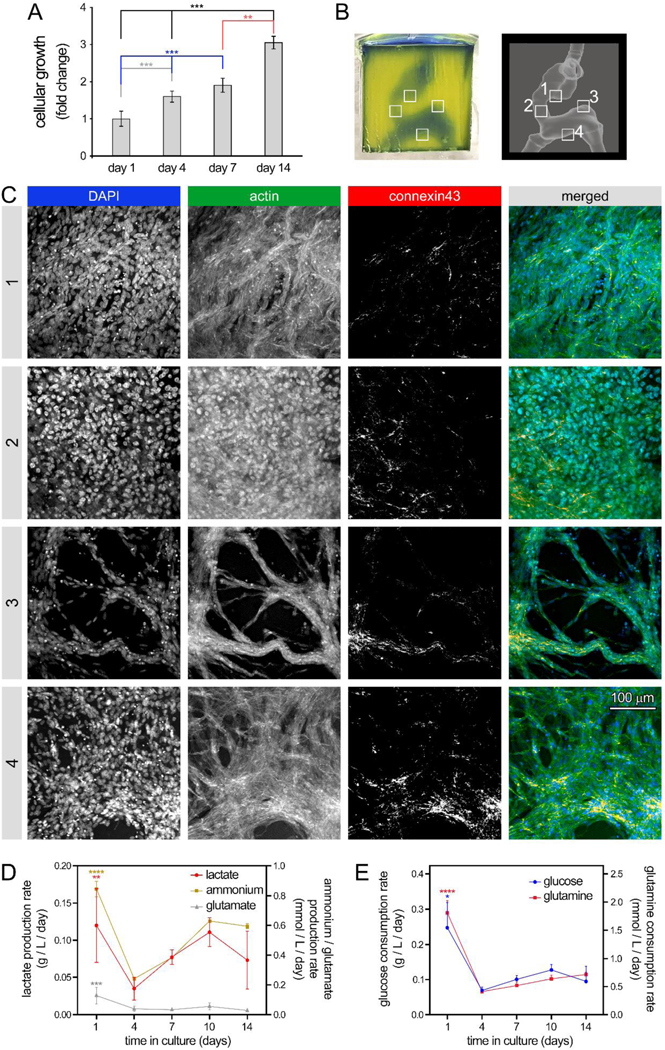
Figure 4: 3D bioprinting of human embryonic heart tube (e-HT) constructs and their endothelization.

A: AlamarBlue metabolic activity assay used to assess endothelial cell (EC) growth seeded onto the luminal space of the bioprinted e-HT constructs. B-Left: A bioprinted e-HT construct, made using gelMA-based bioinks and perfused with PBS (a blue food coloring used for visualization). B-Right: corresponding CAD model used to bioprint the e-HT constructs. The four insets in panel (B) highlight the areas in which the cellular constructs were fixed, sliced, and imaged using immunohistochemical (IHC) assay. C: IHC imaging of bioprinted, cellular e-HT constructs performed after 14 days of in vitro 3D culture. Rows 1 to 4 correspond to the windows 1–4 depicted in the panel (B). From left to right, columns show immunostaining results for DAPI, actin, connexin43, and merged, respectively. D-E: Rate of metabolite production (D) and nutrient consumption (E) throughout the 2-week 3D culture of ECs in bioprinted constructs. There was significantly higher lactate/glutamate/ammonium production and glucose/glutamine consumption at the beginning of the culture (day 1). Metabolic activity was higher at the beginning of the culture (both glycolysis and glutamine metabolism). Note: * p < 0.05; ** p < 0.01; *** p < 0.001; and **** p < 0.0001. p value demonstrates statistically significant difference compared to value in the same group at day 1. An n = 4 of e-HT constructs per condition were used.
