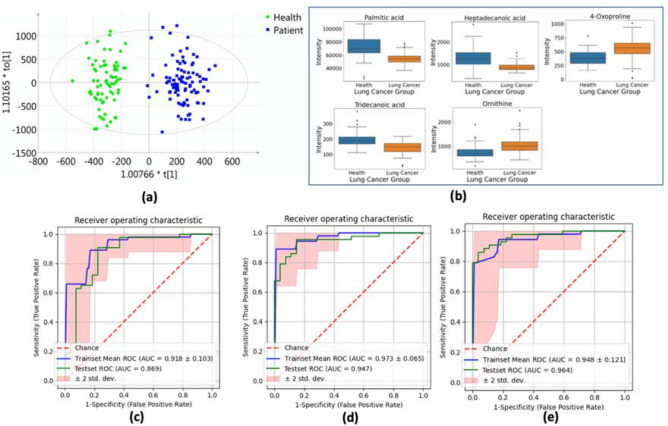
Figure 1.
(a) Orthogonal projection on latent structure discriminant analysis (OPLS-DA) score plot shows the ability to separate lung cancer patients from healthy controls. (b) Box and whisker plots for the top 5 most important metabolites between healthy control and lung cancer groups. (c)-(e) Receiver-operating characteristic (ROC) curves for discriminating healthy controls and lung cancer patients [(c) ROC curves of the logistic model using top 5 metabolomic markers; (d) ROC curves of the logistic model using top 10 metabolomic markers; (e) ROC curves of the logistic model using top 20 metabolomic markers].

