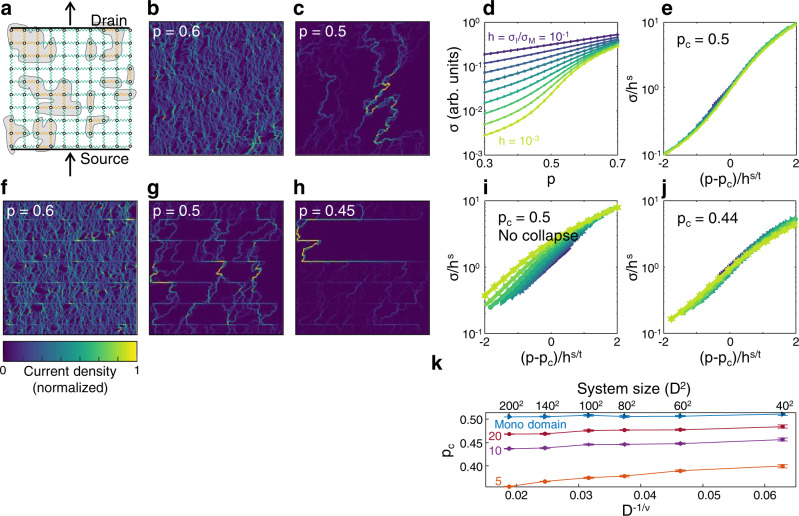
Fig. 3. Size dependence of the metal-insulator transition.
a Illustration of the random resistor network, showing isolated insulating patches (yellow nodes) within the metallic (green nodes) network. b, c Current density maps obtained from individual realizations of a 128*128 network, at (b) and (c). The current was sourced at the bottom side of the square, and drained at the top. At , the current flows along the expected subdimensional fractal. d The conductivity of the network, plotted as a function of , for various bond conductivity ratios . e The data in d rescaled with the universal critical exponents and , showing data collapse at the critical concentration, . Representative realizations of the model with domain boundaries, for (f), (g), and (h). The current carrying backbone in g no longer consists of a single complicated path. Instead, shorter complex paths appear at a lower concentration (h), interconnecting the domain boundaries. The boundaries introduce long, straight lines into the backbone, inconsistent with the expected size scaling of a fractal. i, j Rescaled conductivity data for the critical concentration of the standard model, (i), and for the shifted critical point (j). k Size dependence of the critical concentration, for networks with various domain wall spacings. The mono-domain network shows no size dependence, while the critical concentrations of multi-domain RRNs is lower for larger systems sizes. The size and detail dependence suggest that the transition is not universal. The error bars represent two standard deviations from the mean fitted critical point.

