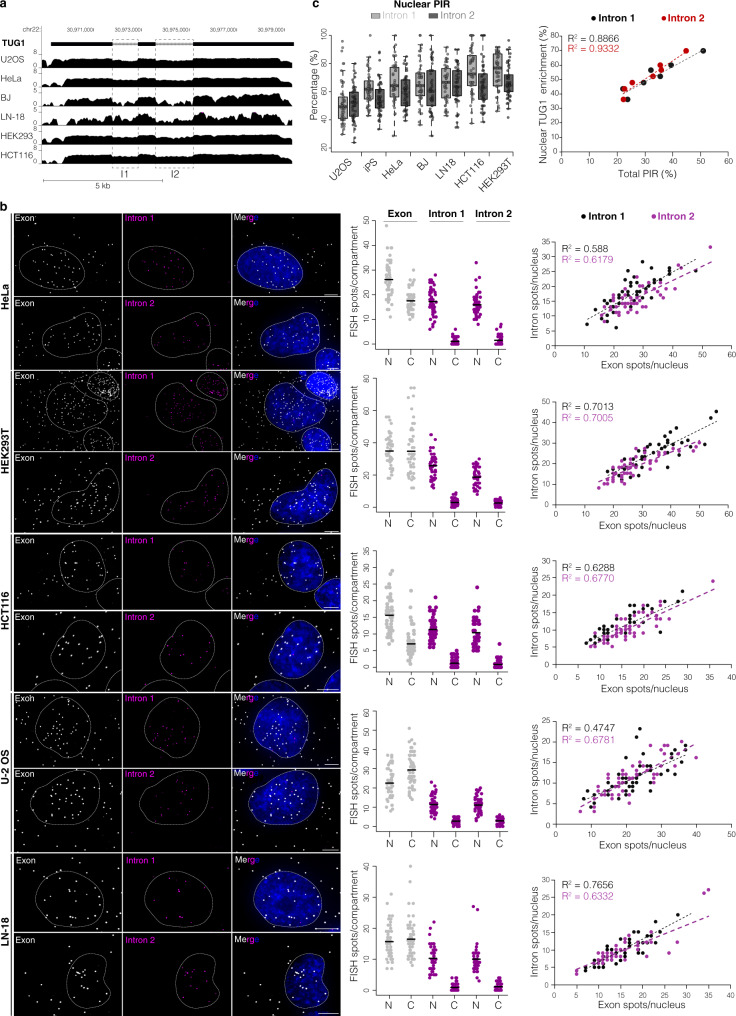
Fig. 2. TUG1 intron retention is common and fluctuates across cell lines.
a UCSC Genome Browser showing poly(A)+ RNA-seq coverage across TUG1 locus (hg38) from multiple cell lines. Scale ln(x + 1). b Maximum intensity projections of representative images of TUG1 exon/intron smRNA FISH across indicated cell lines. Exon, gray; introns 1, 2, magenta; nucleus, blue, outlined with a dashed line. Scale bar, 5 μm. Middle: quantification of total and unspliced transcripts for each intron in the nucleus (N) and cytoplasm (C), solid line represents the mean. Right: correlation between nuclear intron and nuclear TUG1 quantity, intron 1, black; intron 2, magenta. N = 50 cells, at least two independent RNA FISH stainings. c Left: nuclear PIR for each intron across cell lines. Midline line, median; lower and upper box limits, 25th and 75th percentiles; whiskers, 1.5 times the interquartile range from the 25th and 75th percentiles. Right: correlation between TUG1 nuclear enrichment and total PIR between different cell lines. Each data point, mean value from one cell line, all measurements shown in Supplementary Fig. 2b. Intron 1, black; intron 2 red. N = 50 cells, at least two independent RNA FISH stainings.

