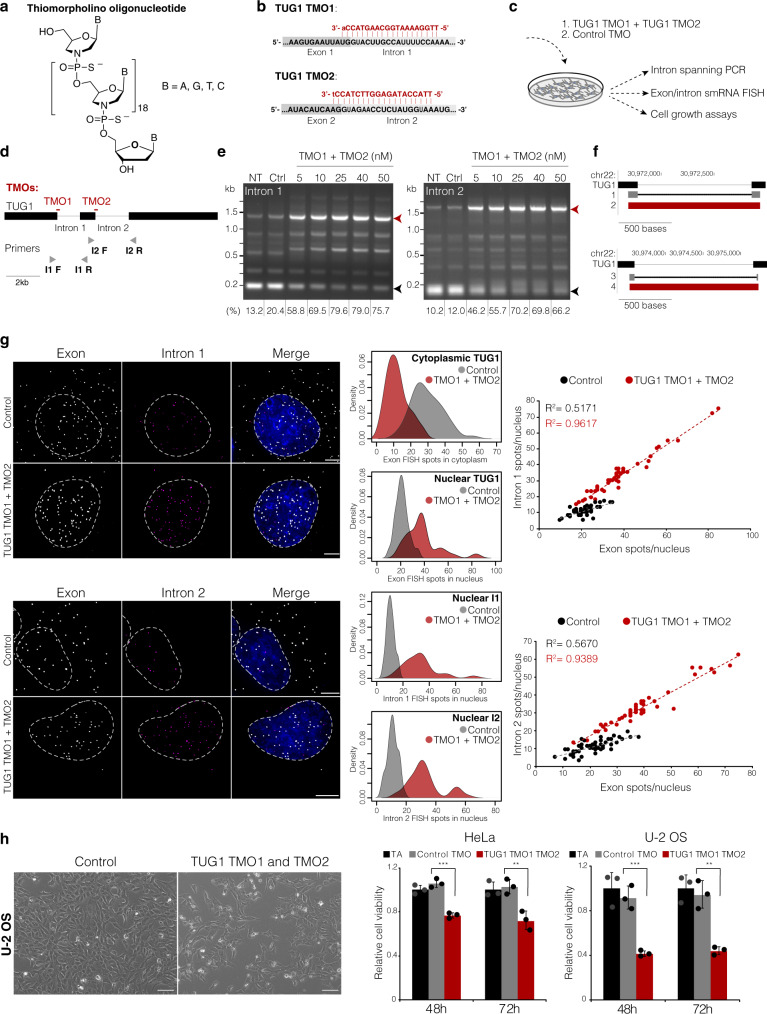
Fig. 7. Intron retention drives nuclear compartmentalization of TUG1.
a The chemical structure of thiomorpholino oligonucleotide (TMO). b The design of TUG1 TMO1 and TMO2 (in red) against the donor splice sites. For TMOs, upper-case red letters refer to thiomorpholino nucleotides and lower-case letters to 2′-deoxynucleosides at the 3′ end of each TMO. c Experimental setup to assess the efficiency of TMO-based intron inclusion and its effect of subcellular localization of TUG1 and cell viability. d TMO location scheme in respect to TUG1 transcript and the location on intron-spanning primers (not to scale). e PCR product of the intron-spanning RT-PCR of untreated (NT), control TMO (Ctrl), and increasing doses of a mixture of TUG1 TMO1 and TMO2. Black arrow, spliced product; red arrow, unspliced product. Below, the percentage of the unspliced products. Kb, kilobases. PCR products after transfecting TUG1 TMOs were examined on agarose gel at least three independent times. Uncropped blot is provided in Source data. f UCSC browser displaying Sanger sequencing results of spliced (band 1) and unspliced (band 2) products for intron 1 RT-PCR (on top). Below, the sequences for spliced (band 3) and unspliced (band 4) products for intron 2 RT-PCR. g Maximum intensity projections of TUG1 exon and intron 1 or intron 2 smRNA FISH in U-2 OS cells transfected with control TMO and with TUG1 TMO1 and TMO2. Exon, gray; intron, magenta; nucleus, blue; scale bar, 5 μm. Towards the right, quantification of nuclear TUG1, cytoplasmic TUG1, intron 1 or 2 retentions in TUG1 TMO1 and TMO2 (red) versus control TMO (gray) samples, n = 50 cells (control), 49 cells (intron 1 TMO1 and 2), 44 cells (intron 2 TMO1 and 2). h, Relative cell viability of HeLa and U-2 OS cells transfected with TUG1 TMO1 and TMO2, control TMO or transfection agent only (TA). Representative images of U-2 OS transfected with control TMO or TUG1 TMO1 and TMO2 shown on the left. Scale bar, 100 μm. **P ≤ 0.01, ***P ≤ 0.001, as evaluated by unpaired two-tailed t-test (equal variances) versus control TMO. Bars, means across replicates; dots, individual replicates, error bars, the standard deviation of the mean of three independent measurements.

