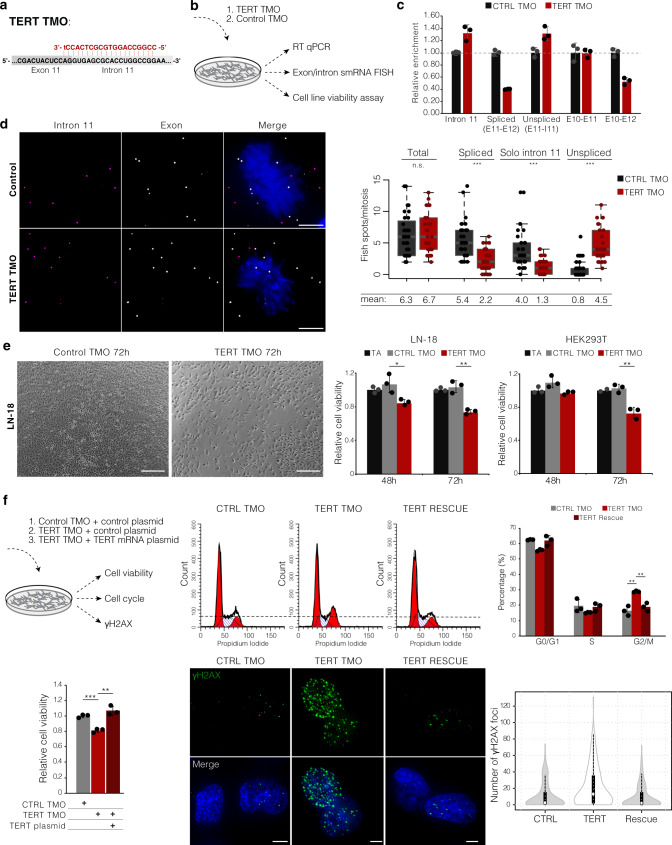
Fig. 8. TMO-based prevention of TERT splicing reduces cell viability in vitro.
a Scheme showing the design of TERT TMO (in red) against the exon11/intron11 donor splice site. The upper-case red letters refer to thiomorpholino nucleotides and the lower-case letter to a 2′-deoxynucleoside at the 3′ end. b Experimental setup to assess the efficiency of TMO-based TERT intron 11 inclusion (RT-qPCR and smRNA FISH) and its effect on cell viability. c Relative expression of TERT intron 11, spliced TERT (Exon10-Exon11, Exon10-Exon12, Exon11-Exon12), and unspliced TERT (Exon11-Intron11) over GAPDH assessed by RT-qPCR. Error bars represent the standard deviation of the mean of three replicates. d Maximum intensity projections of TERT exon (gray) and intron 11 (magenta) smRNA FISH in LN-18 cells transfected with control TMO and TERT TMO. DAPI, blue. Scale bar, 5 μm. On the right, quantification of total TERT (exon signal), unspliced TERT, spliced TERT (ΔI11), and free intron 11 during mitosis of LN-18 cells transfected with control TMO (CTRL) or TERT TMO. N (control TMO) = 32 cells, n (TERT TMO) = 30 cells, two independent RNA FISH stainings. Midline line, median; lower and upper box limits, 25th and 75th percentiles; whiskers, 1.5 times interquartile range from the 25th and 75th percentiles. e Cell viability of LN-18 and HEK293T cells transfected with TERT TMO, control TMO or transfection agent only (TA). Representative images of LN-18 transfected with control TMO or TERT TMO shown on the left. Scale bar, 250 μm. Bars, means across replicates; dots, individual replicates, error bars, standard deviation of the mean of three independent measurements. f Cell viability, cell cycle, and γH2A.X foci analysis of LN-18 cell line 72 h after co-transfection of TERT TMO with spliced TERT expression plasmid, control TMO, and TERT TMO with a control plasmid. Cell viability and cell cycle; bars, means across replicates; dots, individual replicates; error bars, standard deviation of the mean of three independent measurements. Representative images of γH2A.X immunofluorescence are shown, DAPI, blue; γH2A.X, green; scale bar 5 μm. Violin plot, n (control TMO) = 128 cells, n (TERT TMO) = 168 cells, n (rescue) = 153 cells, two independent stainings. White circles, median; box limits indicate the 25th and 75th percentiles; whiskers, 1.5 times the interquartile range from the 25th and 75th percentiles; polygons represent density estimates of data and extend to extreme values. For d, e, and f p values were obtained by unpaired two-tailed t-test (equal variances), n.s. = not significant, *P ≤ 0.05, **P ≤ 0.01, ***P ≤ 0.001.

