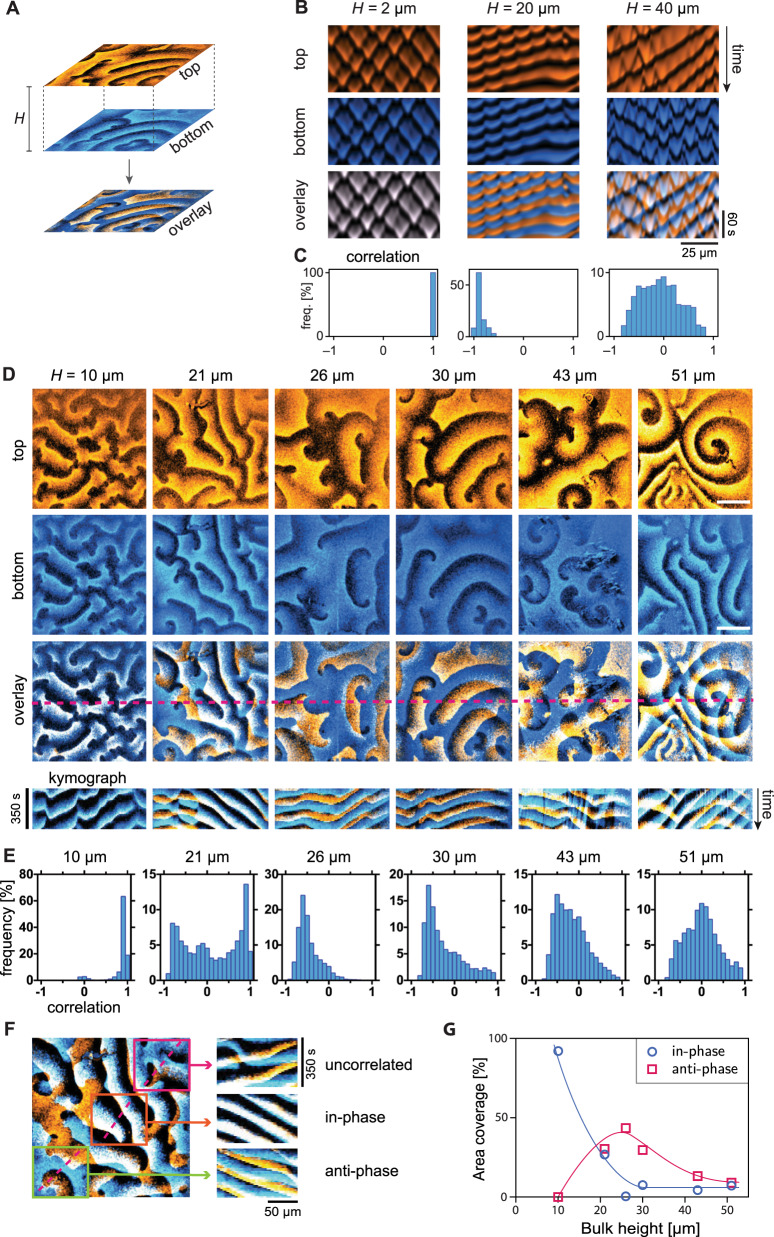
Fig. 4. Min crosstalk between opposite membranes.
A Patterns form on the membranes both on the top and bottom surface of the microchambers. Overlaying these patterns in different colors (blue and orange) reveals the synchronization between them. In the overlay, blue and orange additively mix to white such that white areas signify high concentration on both membranes. Black indicates areas of coinciding low protein density. B Kymographs from simulations in slice geometry (1 + 2D) showing perfect in-phase synchrony of patterns at low bulk height, antiphase synchrony driven by membrane-to-membrane mass transport for intermediate bulk height and desynchronization for large bulk height, where two membranes effectively decouple. (E:D ratios from left to right: 0.75, 0.725, and 0.55). C Histograms of the correlation between top and bottom membrane corresponding to the kymographs in B. The correlation was calculated between concentration time-traces over a 100 s interval at regularly spaced spatial positions (Δx = 0.25 μm). D Snapshots and kymographs from simultaneous (<0.1 s delay) imaging of MinE on the top (orange) and bottom (blue) membrane in microchambers of different heights (1 μM MinD, 1 μM MinE). Bars correspond to 50 μm. E Each field of view (FOV) was divided into a grid of cells for which the correlation analysis was performed individually. Histograms show frequency distribution of correlations of individual cells in the grid measured for 30 timepoints in each FOV. Perfect in-phase correlation corresponds to a correlation value of 1 and perfect antiphase to a value of −1, respectively; lack of correlation corresponds to a correlation measure of 0. F Example of coexistence of in-phase and antiphase synchrony within adjacent spatial regions. G Classification of top-bottom correlation as a function of bulk height, extracted from the histograms in panel D. Correlation values above 0.7 are classified as correlated, values less than −0.3 as anticorrelated. (Source data are provided as a Source Data file).

