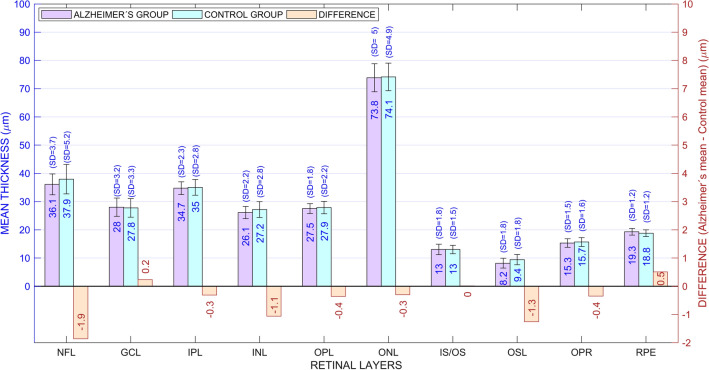
Figure 1.
Thickness of retinal layers for patients and controls. The mean thickness is shown within the bars and the standard deviation (SD) is shown above. The difference between the two groups is displayed in orange bars, whose length has been amplified (× 10) to show the trend of retinal layers to be thinner in the AD group. NFL nerve fiber layer, GCL ganglion cell layer, IPL inner plexiform layer, INL inner nuclear layer, OPL outer plexiform layer, ONL outer nuclear layer, IS/OS inner segment/outer segment layer, OSL outer segment layer, OPR outer segment PR/RPE complex, RPE retinal pigment epithelium.

