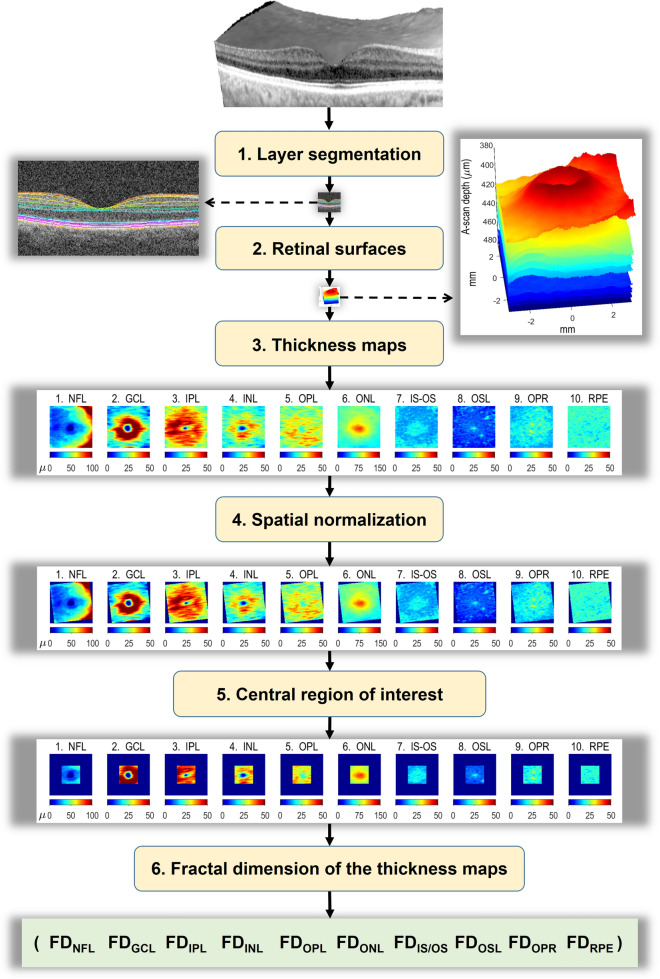
Figure 5.
OCT postprocessing. (1) Layer segmentation. In each OCT, the 10 retinal layers listed below were separated using a fully automatic algorithm. (2) Retinal surfaces. We obtained the 11 surfaces delimiting the 10 retinal layers listed below. (3) Thickness maps. At each retinal point scanned, the thickness of the retinal layer was calculated as the distance between its two bounding surfaces in the direction orthogonal to the layer. (4) Spatial normalization. The set of the 10 thickness maps of each participant was moved, rotated and scaled so that the macular and papillar centers of all subjects overlapped (5) Central region of interest. The largest square region available in all layers for all subjects was selected for analysis, its side being 2.555 mm. (6) Fractal dimension of the thickness map in the central square was finally calculated as the index of its roughness. FD fractal dimension, NFL nerve fiber layer, GCL ganglion cell layer, IPL inner plexiform layer, INL inner nuclear layer, OPL outer plexiform layer, ONL outer nuclear layer, IS/OS inner segment/outer segment layer, OSL outer segment layer, OPR outer segment PR/RPE complex, RPE retinal pigment epithelium. Images created using MATLAB (2018a) www.mathworks.com/products/matlab, Layer Segmentation Module of The Iowa Reference Algorithms (3.6) www.iibi.uiowa.edu/oct-reference and Heidelberg Eye Explorer (1.10.4.0) www.HeidelbergEngineering.com.

