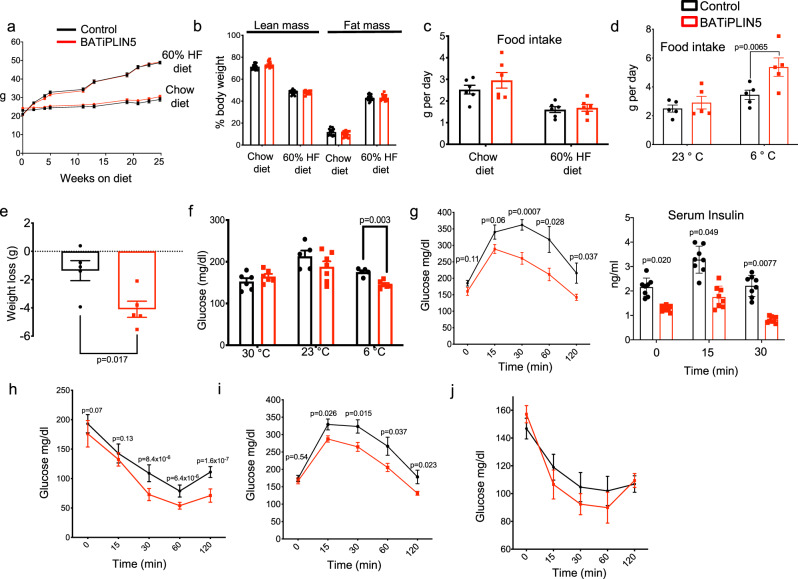
Fig. 2. PLIN5 overexpression in BAT improves glucose tolerance and insulin sensitivity at room temperature with changes in weight and blood glucose only during cold exposure (data for Control mice are in black and for BATiPLIN5 mice in red).
a Body Weight at the indicated time points of Control or BATiPLIN5 mice that were fed chow (Control n = 27, BATiPLIN5 n = 23 mice) or HF diet (Control n = 12, BATiPLIN5 n = 16 mice). b Mass composition after 8 weeks on Chow or HF diet. (Control n = 15, BATiPLIN5 n = 16 mice for each diet). c Daily food intake measurement during 6-day period in mice housed at 23 °C. Before measurement mice were fed for 8 weeks with chow or HF diet. n = 6 mice per group. d Daily food intake during 6-day period in mice housed at 23 or 6 °C. Before exposure to cold mice were fed for 8 weeks with chow diet and housed at 23 °C. n = 5 mice per group. e Weight loss in mice housed at 6 °C for 15 days. n = 5 per group. f Blood glucose of mice housed at 23 °C or exposed to 30 or 6 °C for 24 h. Glucose was measured in fed state at 9 a.m. n = 8 mice per group. g Oral glucose tolerance test (OGTT) after 8 weeks on HF diet. Glucose (left panel) and insulin levels (right panel) at the indicated time points. n = 8 per group. h Insulin tolerance test (ITT) after 8 weeks on HF diet (n = 10 Control n = 9 BATiPLIN5 mice). i OGTT after 8 weeks on chow diet. Glucose levels at the indicated time points (n = 15 Control n = 16 BATiPLIN5 mice). j Insulin tolerance test (ITT) after 8 weeks on chow diet. Glucose levels at the indicated time points. (n = 15 Control n = 16 BATiPLIN5 mice). Data are presented as means ± s.e.m. For a–i, we used unpaired two-sided Student’s t test for statistical analysis. Source data are provided as a Source data file.

