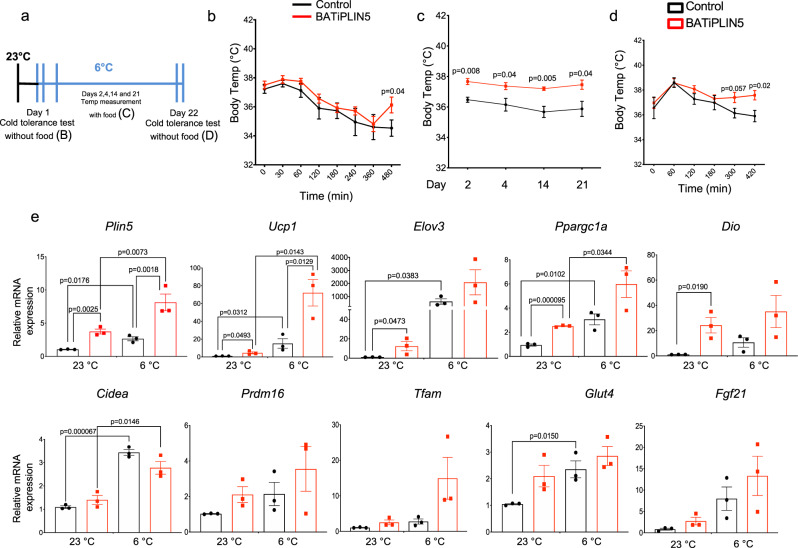
Fig. 3. PLIN5 overexpression in BAT increases cold tolerance, cold acclimation, and thermogenic gene expression in BAT.
a Timeline for cold tolerance experiments for b–d. Mice were housed at 23 °C before cold tolerance experiments. b Body temperature at the indicated time points during acute cold tolerance test. n = 10 mice per group. c Body temperature in fed mice housed at 6 °C on the indicated days. n = 10 mice per group. d Body temperature at the indicated time points during acclimation cold tolerance test. n = 10 mice per group. e Relative mRNA expression by qPCR for the indicated genes in BAT from Control or BATiPLIN5 mice housed at 23 °C or exposed 6 °C for 16 h. n = 3 mice per group. Data are presented as means ± s.e.m. For b–d, unpaired two tailed Student’s t test was used for statistical analysis. For e, statistical analysis was performed using two-ANOVA followed by Tukey posttest. P values are shown in the figure. Source data are provided as a Source data file.

