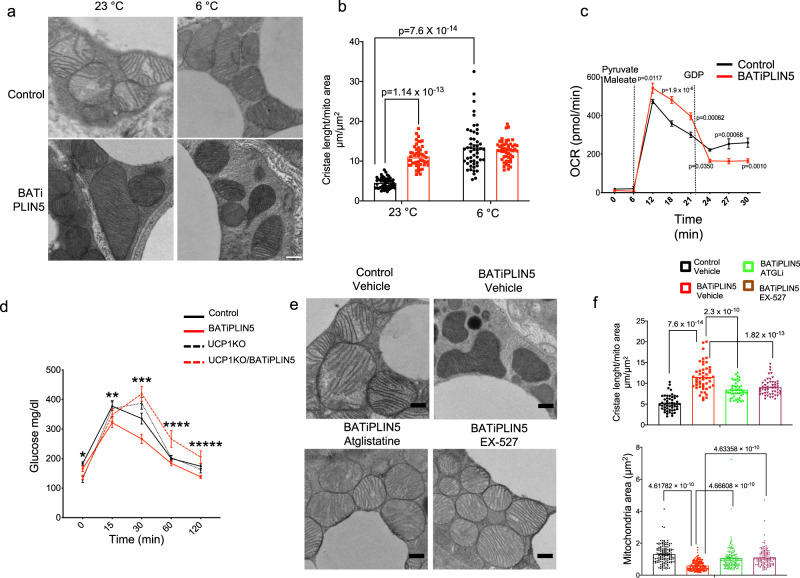
Fig. 6. PLIN5 overexpression in brown adipose tissue increases mitochondrial cristae packing and UCP1-dependent mitochondrial respiratory function.
a Representative electron microscopy (EM) images of BAT from Control or BATiPLIN5 mice housed at 23 °C or exposed at 6 °C for 16 h. Scale bar = 0.5 μm. b Quantification of total mitochondria cristae length normalized to mitochondrial area in BAT from Control or BATiPLIN5 mice housed at 23 °C or exposed at 6 °C for 16 h. n = 50 mitochondria/group. c Oxygen consumption rate (OCR) from BAT mitochondria isolated from Control or BATiPLIN5 mice housed at 23 °C after sequential injection of pyruvate/maleate and GDP. n = 3 mice per group. d Oral glucose tolerance test comparing Control (n = 14), BATiPLIN5 (n = 11), UCP1KO (n = 6), and UCP1KO/BATiPLIN5 mice (n = 8). e Representative electron microscopy (EM) images of BAT from Control or BATiPLIN5 mice housed at 23 °C and treated with Vehicle or Atglistatine or Ex-527. f Quantification of total mitochondria cristae length normalized to mitochondrial area in BAT from Control or BATiPLIN5 mice housed at 23 °C and treated with Vehicle or Atglistatine or Ex-527. n = 50. Values are mean ± s.e.m. For b, statistical analysis was performed using two-way ANOVA followed by Tukey posttest. P values are shown in figure. For c, statistical analysis was performed using unpaired two-sided Student’s t test. For d, statistical analysis was performed using two-way ANOVA followed by Tukey posttest. P values as follows, *time 0: Control vs UCP1KO p = 0.0217, Control vs. UCP1KO/BATiPLIN5 p = 0.0276, **time 15: Control vs. BATiPLIN5 p = 0.0037, BATiPLIN5 vs. UCP1KO p = 0.0472, ***time 30: Control vs. BATiPLIN5 p = 0.0003, Control vs. UCP1KO p = 0.0261, Control vs. UCP1KO/BATiPLIN5 p = 0.00009, BATiPLIN5 vs. UCP1KO p = 0.000001, BATiPLIN5 vs. UCP1KO/BATiPLIN5 p = 0.00000000006, ****time 60: Control vs. UCP1KO/BATiPLIN5 p = 0.0019, BATiPLIN5 vs. UCP1KO/BATiPLIN5 p = 0.0002, UCP1KO vs. UCP1KO/BATiPLIN5 p = 0.0148, *****time 120: BATiPLIN5 vs. UCP1KO/BATiPLI5 p = 0.0026. For f, statistical analysis was performed using one-way ANOVA followed by Tukey posttest. P values are shown in figure. Source data are provided as a Source data file.

