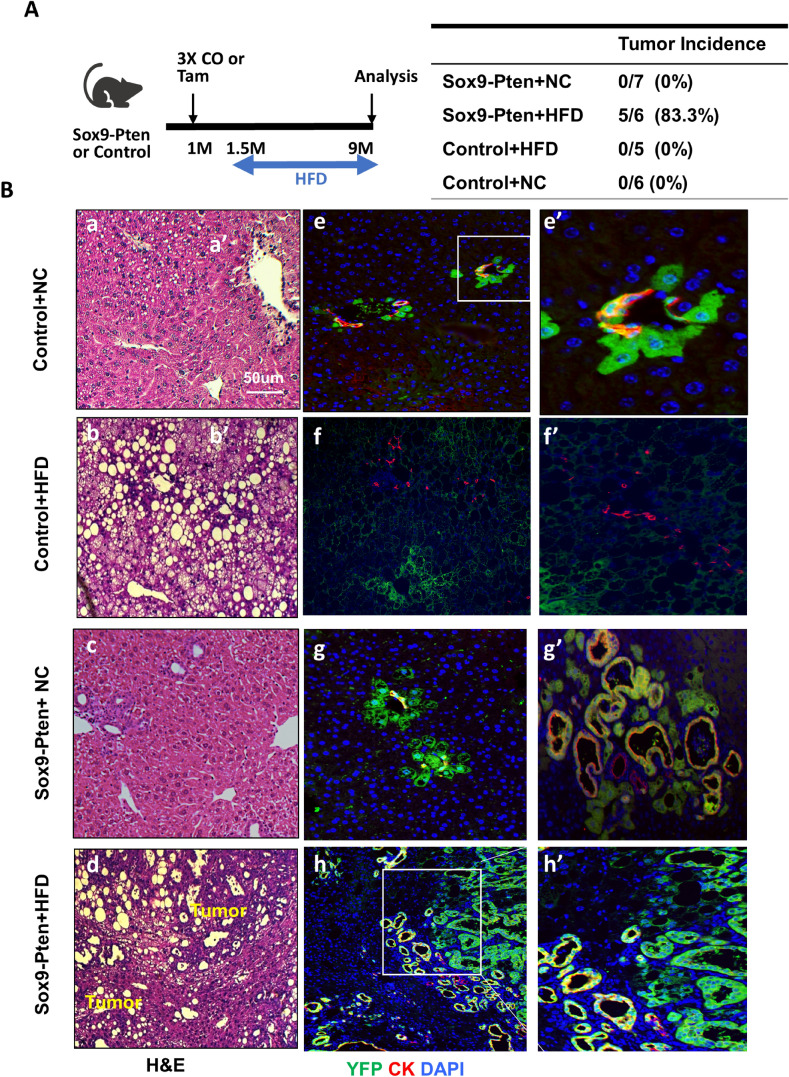
Figure 2.
High fat diet promotes liver cancer development in Sox9-Pten mice. (A) Left, tamoxifen injection and diet protocol. Diet is initiated at 1.5 month and tissues collected at 9 months of age. Right, quantitative analysis of tumor development in control and Sox-Pten mice on normal chow (NC) and high fat diet (HFD). (B) Representative microscopic images of the livers from Sox9-Pten and control mice on HFD. Panels a-d, H&E to indicate morphology of the liver sections. Liver tumors were only observed in HFD fed Sox9-Pten mice. Panels e–h and e′-h′ are stained with YFP (green) + CK (red). e′ and h′ are amplified views of the boxed areas of e and h respectively. f′ is amplified views of select ductal hyperplasia that show the lack of YFP in ductal hyperplasia observed in the HFD fed control mice. g′ is amplified views of select rare ducts that show VMC morphology in the Sox9-Pten mice fed HFD diet. Blue, DAPI to mark nuclei. Control mice are: Pten loxP/loxP; Cre- mice with no treatment; Pten+/+; Sox9-CreERT mice treated with either corn oil (CO) or tamoxifen; or PtenloxP/loxP; Sox9-CreERT mice treated with coil oil.

