Figure 5.
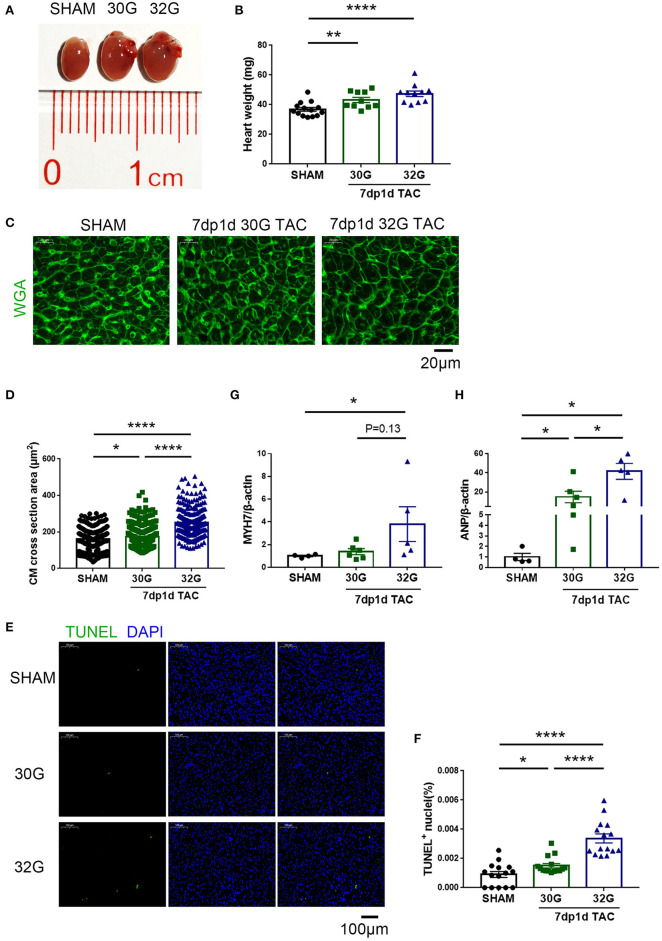
Apoptosis and hypertrophy increased in mice 7 days after the 30G and 32G TAC surgery. (A) The hearts of mice in the sham (left), 30G TAC (middle), and 32G TAC (right) groups. (B) The heart weight analysis in the three groups: n = 14, sham; n = 10, 30G TAC; n = 11, 32G TAC. (C) Representative heart sections stained with WGA (green) in the three groups. Scale bar: 20 μm. (D) Analysis of cardiomyocyte cross-sectional area in the three groups; n = 3 hearts per group. A total of 250-300 cardiomyocytes per group were analyzed. (E) Representative images of terminal deoxynucleotidyl transferase dUTP nick end labeling (TUNEL, green)-positive cells from the heart sections in the three groups. Scale bar: 100 μm. (F) Statistical chart of TUNEL-positive cells in the three groups; n = 3 hearts per group. Each heart slide was random selected with five high-power fields for statistical analysis. (G,H) Quantitative real-time polymerase chain reaction (qRT-PCR) for the expression of myosin heavy chain-β (MYH7) and atrial natriuretic peptide (ANP), respectively, in the ventricular tissue; n = 4, sham; n = 6, 30G TAC; n = 5, 32G TAC. Data are presented as mean ± SEM. *P < 0.05, **P < 0.01, and ****P < 0.0001. Statistical significance was calculated using the unpaired two-tailed t-test or Mann–Whitney test.

