
Figure 1.
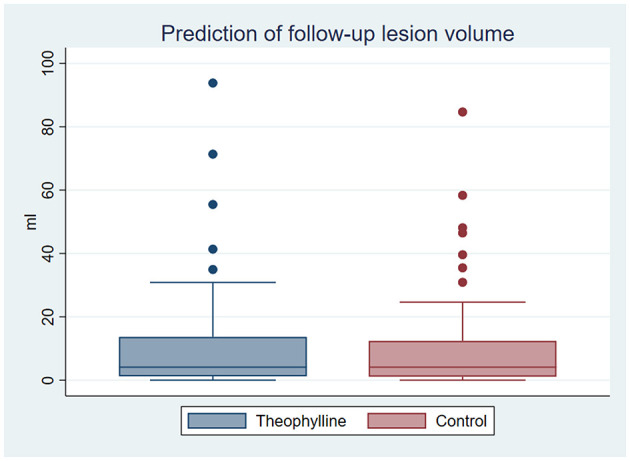
Predicted volume of follow-up lesions. Box-whisker diagram depicting the mean predicted volumes of follow-up lesions based on the trainings datasets of patients treated with theophylline and placebo: Interquartile range with median (box), lower and upper interquartile +1.5 interquartile range (whisker), and outliers (dots).