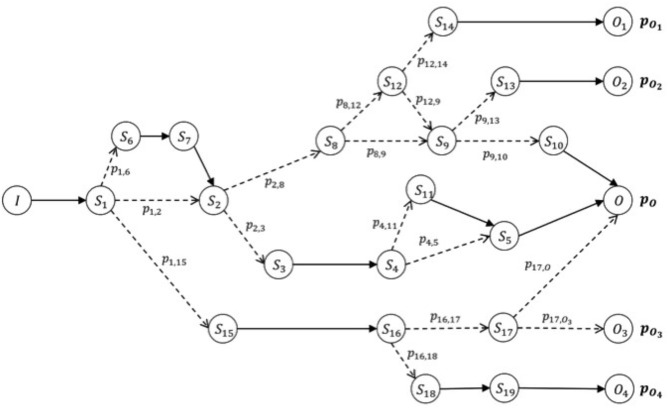
Figure 2.
Oriented graph of possible patient journeys. Example of a graph that models the data collected for a cluster of journeys, according to their specific initial features (condition on admission), I. The expected (or positive) result of this path is O, which can be reached with probability pO. The patient's risk is defined by the probability of reaching different final conditions given the same starting condition upon admission. The risk of obtaining a final condition different from O, starting from condition I on admission, is given by the list of probabilities [p (O1), p (O2), p (O3), p (O4)]. Each node of the graph represents a possible step (initial, intermediate, or final) of the journey (and thus a stage of the patient's condition between admission and discharge), and each edge (or line between nodes) represents a possible succession of steps/stages according to the probability of encountering each of them. Such journeys make up our knowledge base. In particular, we can calculate the probability of arriving at the final step/stage, given any initial node of the graph, be it initial or intermediate.

