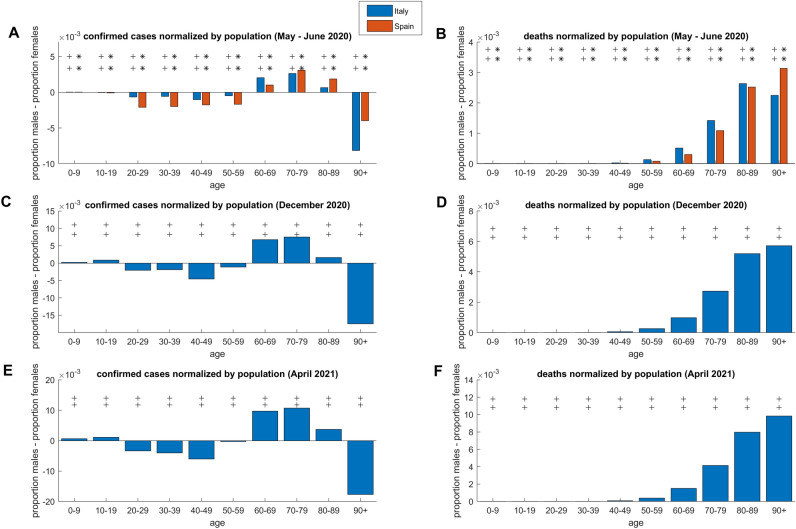
Figure 4.
Data comparison of Spain and/or Italy COVID-19 outbreak for population normalized open access variables which are common to both national data sources in different time points from May 2020 to April 2021. (A) Confirmed cases normalized by national population in Spain (May 29, 2020) and Italy (June 3, 2020). (B) Deaths normalized by national population in Spain (May 29, 2020) and Italy (June 3, 2020). (C) Confirmed cases normalized by national population in Italy (December 29, 2020). (D) Deaths normalized by national population in Italy (December 29, 2020). (E) Confirmed cases normalized by national population in Italy (April 14, 2021). (F) Deaths normalized by national population in Italy (April 14, 2021). The presence of at least one symbol (star for Spain and plus for Italy: 1 symbol indicates p-values below 0.05, 2 symbols p-values below 0.001) on top of a specific age strata indicates that the sex inequality is statistically significant. For all panels, the line on zero indicates the threshold over which, for the respective variable, the impact of COVID-19 on males is larger than on females.

