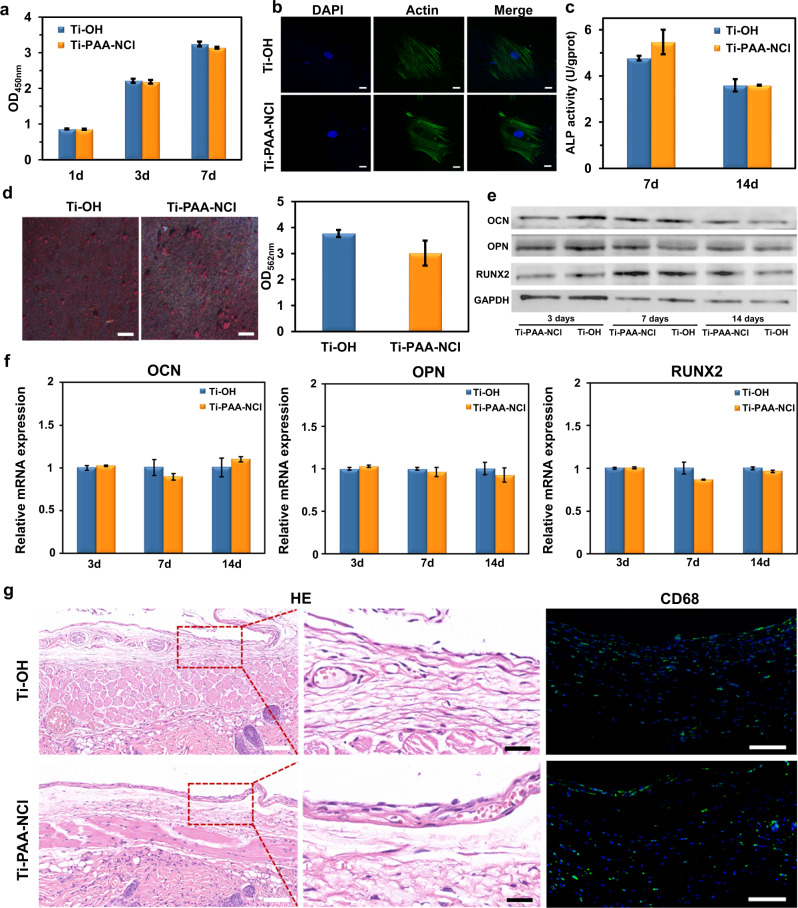
Fig. 5. Biocompatibility assessments.
a CCK-8 assay about the proliferation of MC3T3-E1 preosteoblasts cultured on Ti-OH and Ti-PAA-NCl after cells were cultured for 1, 3 and 7 days (n = 3; P = 0.673, 0.639 and 0.145 for 1, 3 and 7 days compared with Ti-OH, respectively; Student’s t test). b Morphology of MC3T3-E1 preosteoblasts cultured on Ti-OH and Ti-PAA-NCl for 1 day (green for F-actin, blue for cell nucleus, scale bar = 20 μm). c ALP activity of MC3T3-E1 preosteoblasts cultured on Ti-OH and Ti-PAA-NCl for 7 and 14 days (n = 3; P = 0.132 and 0.954 for 7 and 14 days compared with Ti-OH; Student’s t test). d Alizarin Red S staining of MC3T3-E1 preosteoblasts cultured on Ti-OH and Ti-PAA-NCl for 21 days (red for calcium nodules, scale bar = 1 mm) and semi-quantitative measurement of calcium content (n = 3; P = 0.147 compared with Ti-OH; Student’s t test). e Western blot results of osteogenic-related proteins (OCN, OPN and RUNX2) expressed in MC3T3-E1 preosteoblasts cultured on Ti-OH and Ti-PAA-NCl for 3, 7 and 14 days after osteogenic induction. f RT-qPCR results of expression levels of osteogenic-related genes (OCN, OPN and RUNX2) in MC3T3-E1 preosteoblasts cultured on Ti-OH and Ti-PAA-NCl for 3, 7 and 14 days after osteogenic induction (n = 3; P > 0.05 for all time points of these three genes between groups; Student’s t test). g In vivo biocompatibility. HE staining and CD68 immunofluorescent staining of tissues around Ti-OH and Ti-PAA-NCl embedded in the backs of nude mice for 4 weeks (fluorescent green for CD68, fluorescent blue for cell nucleus, white scale bars in HE images = 100 μm, black scale bars in HE images = 25 μm, scale bars in CD68 immunofluorescent images = 100 μm). All error bars = s.d.

