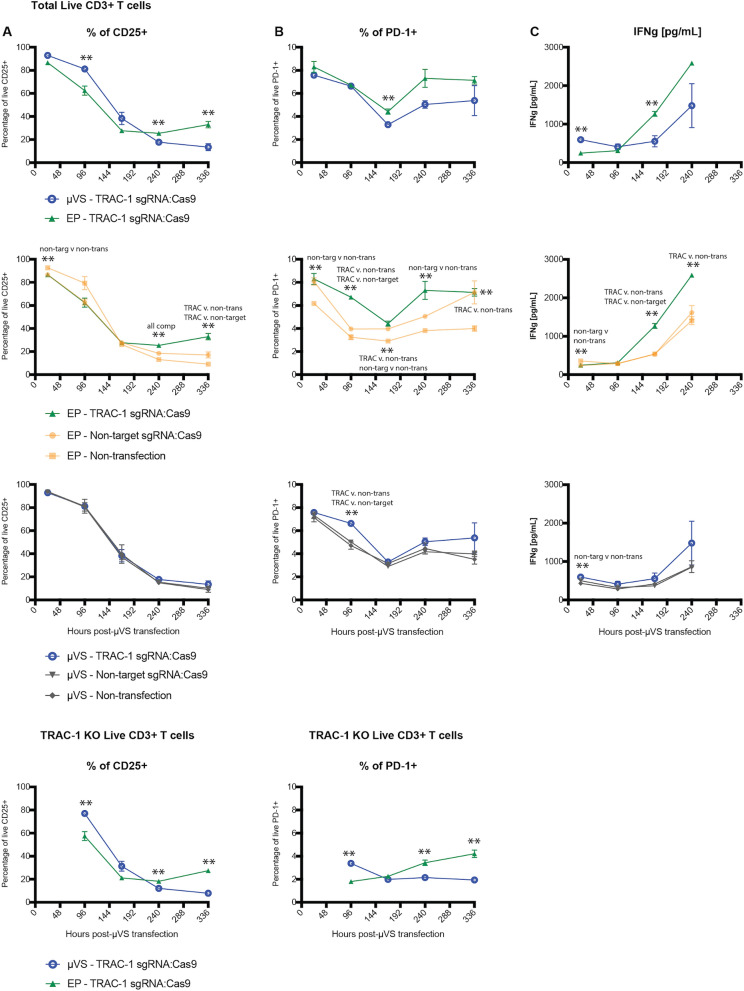
Figure 4.
Surface marker expression and cytokine secretion levels minimally perturbed with Cas9 and µVS. (A) CD25, and (B) PD-1 expression levels were quantified in cells transfected with µVS or electroporation. Surface marker expression levels were measured in the total live cell and TRAC-1 KO live population via flow cytometry at Days 1, 4, 7, 10 and 14 post-transfection. (C) ELISA quantification of IFNγ supernatant levels in transfected and non-transfected cells at Day 1, 4, 7, and 10 post-transfection. Non-targeting gRNA as a Cas9–RNP complex served as a non-editing control. Cells mixed with P3 buffer (EP—non-transfection) or Opti-MEM buffer (µVS—non-transfection) that were not transfected served as non-transfection controls for electroporation and µVS samples, respectively. Data represent mean ± SD of n = 3 samples per condition. *P < 0.05, **P < 0.01 by unpaired, two-tailed, heteroscedastic t tests. Figure generated using Adobe Illustrator Creative Cloud (adobe.com/products/illustrator.html) and GraphPad Prism 9 (graphpad.com/scientific-software/prism/).

