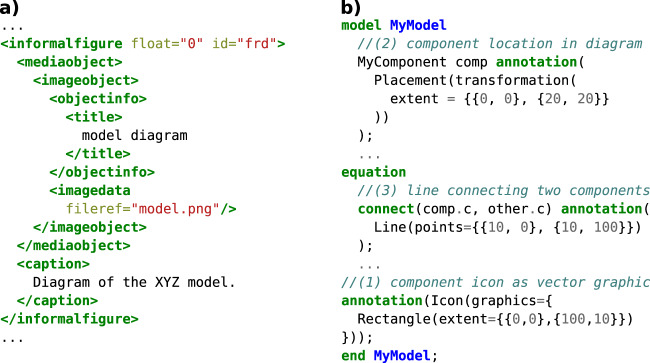
Fig. 4. Two different ways in which modeling languages can support graphical representations of models as part of their syntax.
a CellML allows to include diagrams or plots as figures in the model documentation. The image files remain separate from the model code and have no semantic connection to it except for the figure caption. b Modelica allows to add graphical annotations using a vector graphics syntax. Models and their components can have icons graphics (//(1)), which can be placed in a diagram coordinate system (//(2)) and connected with lines (//(3)). This graphical representation is tied to the structure of the model. If, e.g., a component is removed from a model, the placement annotation (//(2)) must also be removed, which automatically updates the diagram and ensures that it still accurately reflects the new model structure.

