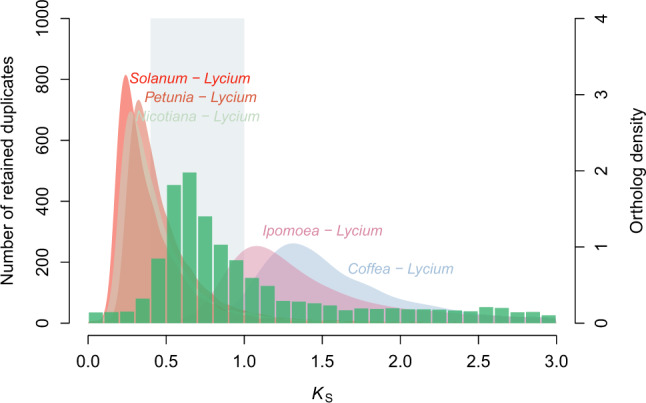
Fig. 2. Whole-genome duplication in Solanaceae.

KS age distributions for anchor pairs of L. barbarum (green histogram; left hand y-axis; a peak represents an ancient polyploid event) and for one-to-one orthologues between L. barbarum and S. lycopersicum, N. tabacum, P. axillaris, I. nil, and an outgroup species C. canephora (colored filled curves of kernel-density estimates; a peak represents a species divergence event). The gray rectangles highlight the peak found in the anchor pair KS distributions with a range of 0.4–1.0.
