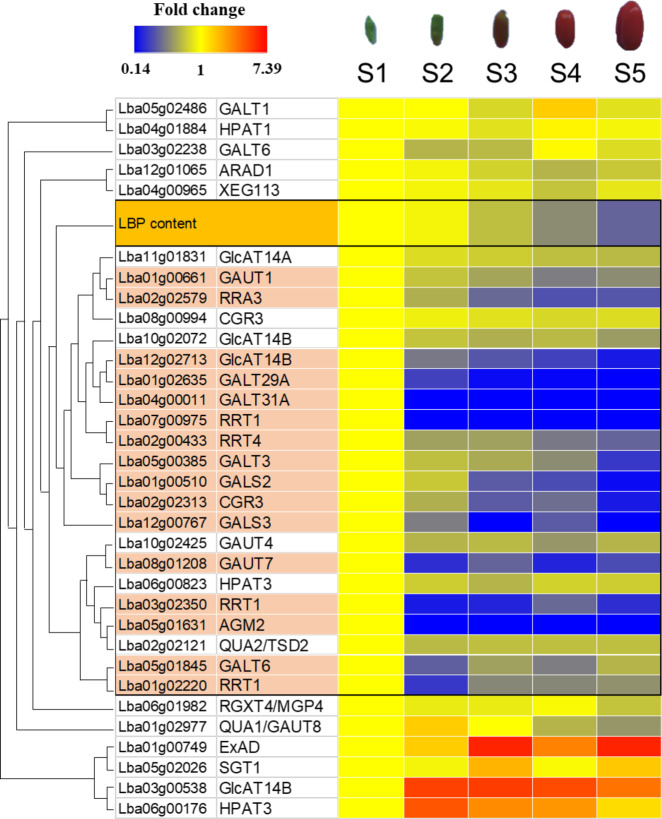
Fig. 3. Heat map of L. barbarum polysaccharide (LBP) and expression of putative genes responsible for LBP biosynthesis during fruit development in Lycium.
Fruit development was divided into five stages (S1–S5), as shown at the top of the figure. LBP contents or fragments per kilobase million (FPKM) values of all genes in the S1 stage were set to 1, and the fold changes of LBP contents or FPKM for the other stages (S2–S5) were calculated. LBP contents and gene expression patterns during fruit development are shown in red (high)–yellow–blue (low) gradation. Only FPKM fold changes >0.5 were considered as downregulation. Genes marked in light orange represent candidate genes for LBP biosynthesis. The localization of these gene products and the relationship of GTases with LBP structures are indicated in Supplementary Fig. 26. S1: young stage, 9 days post anthesis; S2: green stage, 15 days post anthesis; S3: turning stage, 21 days post anthesis; S4: red stage, 28 days post anthesis; S5: ripe stage, 35 days post anthesis.

