
Figure 3.
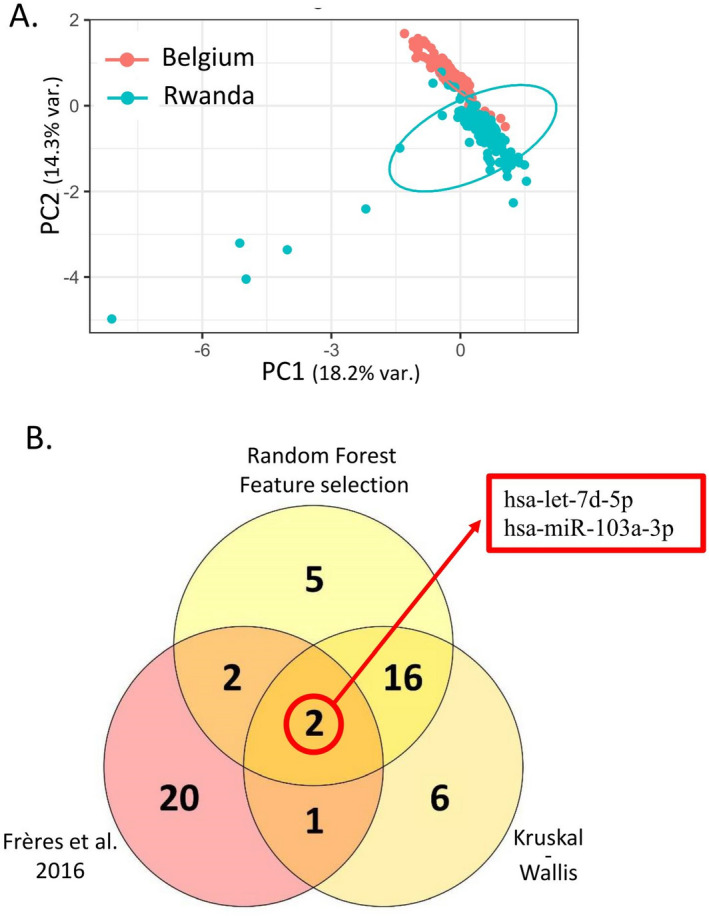
Circulating microRNA contents are different in Belgian- and Rwandan-recruited populations. (A) Principal Component Analysis performed on the plasmatic microRNAs from cohorts MATCHED-BE (red) and MATCHED-RW (blue) shows that the two populations display distinct profiles. (B) The best 25 circulating microRNAs able to discriminate Belgium-from Rwanda-recruited women were determined either by random forest feature selection or by Kruskal–Wallis statistical test and are represented in the two yellow sets. The 25 circulating microRNAs that were best performing to discriminate healthy women from breast cancer patients in a Belgian-recruited population as determined in the publication Frères et al. are represented in the pink set. The Venn diagram is showing the intersection of these three groups, highlighting hsa-let-7d-5p and hsa-miR-103a-3p that are able to both discriminate healthy/cancer and Rwanda/Belgium women.