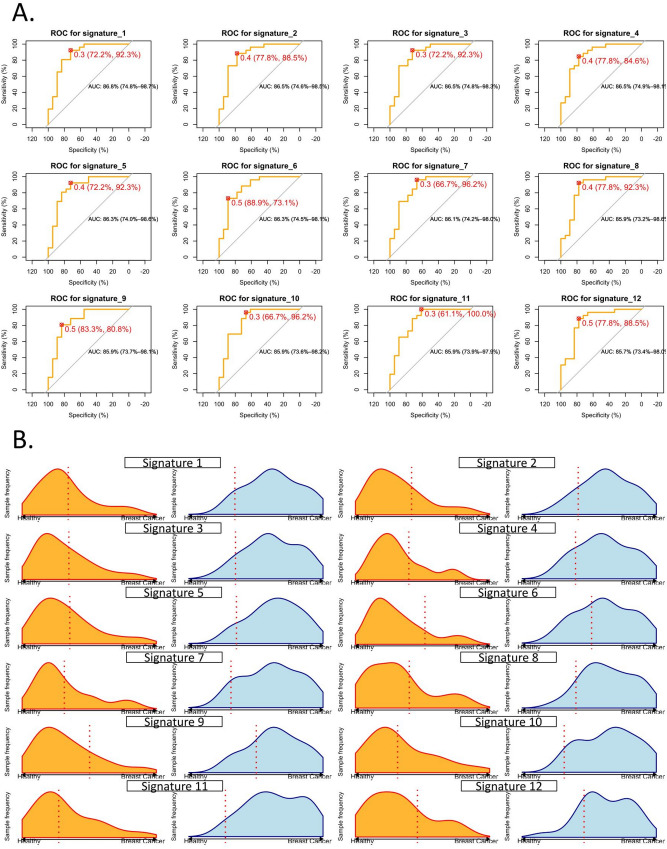
Figure 6.
Performances of the 12 best circulating microRNA signatures able to discriminate breast cancers from healthy women in Rwandan-recruited subjects. (A) ROC curve analysis, optimal cut-off, and corresponding specificity and sensibility (red brackets) of the top signatures. Optimal cut-offs are calculated using the Youden index and are displayed in red. The confidence intervals of the AUC values are displayed in black brackets (B) Model outcome distributions for the breast cancer and healthy subjects. The x-axis corresponds to the model predictions. The dashed line represents the chosen threshold used to compute the sensitivity and specificity values for each group. Orange distribution contains healthy subjects; breast cancer subject distributions are displayed in blue. Names of the signatures are referring to Table 3.

