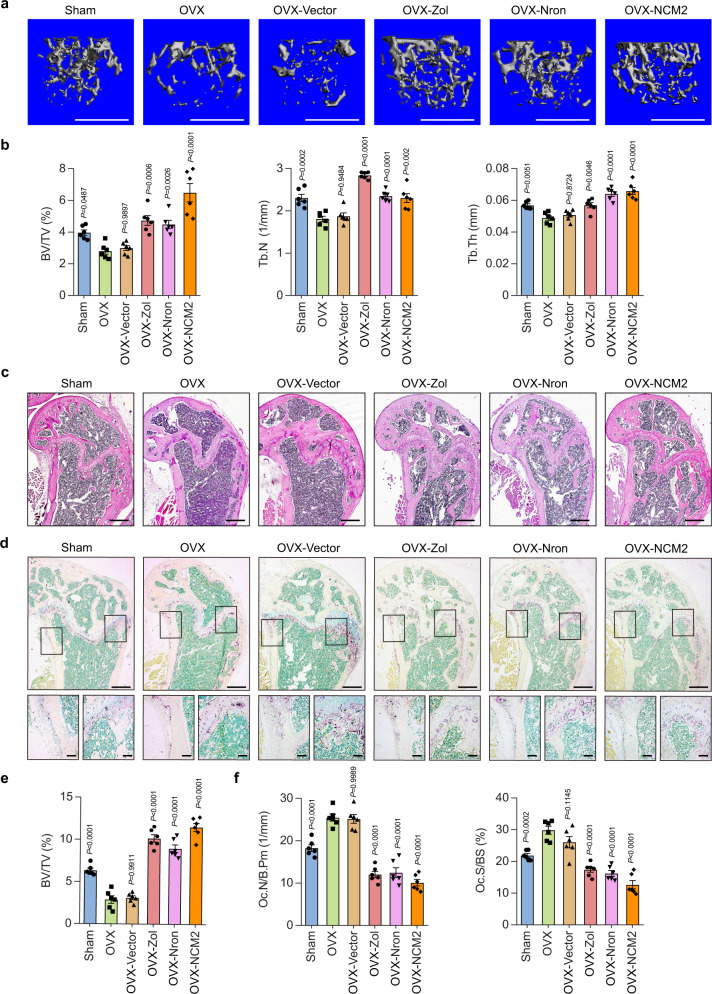
Fig. 7. Osteoclast-targeting delivery of functional motif of Nron increases bone mass in osteoporotic mice.
a Representative μCT images showing the 3D bone structures of femurs from Sham, OVX, OVX-Vector, OVX-Zol, OVX-Nron, and OVX-NCM2 group, (similar results were obtained in all mice, n = 6/group). Scale bar: 1 mm. b μCT measurements of BV/TV, Tb.N, and Tb.Th in femurs from Sham, OVX, OVX-Vector, OVX-Zol, OVX-Nron, and OVX-NCM2 group, (n = 6/group). c Representative H&E staining images of femurs from Sham, OVX, OVX-Vector, OVX-Zol, OVX-Nron, and OVX-NCM2 group, (similar results were obtained in all mice, n = 6/group). Scale bar: 500 μm. d Representative TRAP staining images of femurs from Sham, OVX, OVX-Vector, OVX-Zol, OVX-Nron, and OVX-NCM2 group, (similar results were obtained in all mice, n = 6/group). Scale bar: 500 μm (upper panels); 100 μm (lower panels). e Histological measurements of BV/TV values in c, (n = 6/group). f Quantification of osteoclastic metrics Oc.N/B.Pm and Oc.S/BS in subepiphyseal region of femurs in d, (n = 6/group). Data are presented as the means ± s.e.m. The significant differences between Sham/OVX-Vector/OVX-Zol/OVX-Nron/OVX-NCM2 treatment group with OVX group were determined by one-way ANOVA with Dunnett’s multiple comparisons test. Source data are provided as a Source Data file.

