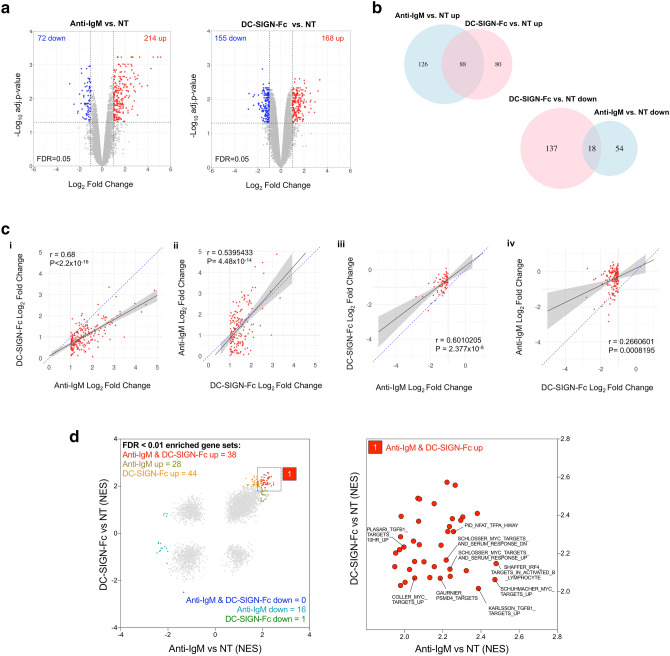
Figure 1.
Effect of DC-SIGN on gene expression in primary FL samples. (a–d) RNA-seq analysis in FL samples FL-B536, FL-LY86 and FL-LY221 stimulated with anti-IgM or DC-SIGN-Fc. (a) Volcano plots showing effect of anti-IgM (left) or DC-SIGN-Fc (right) on gene expression in anti-IgM/DC-SIGN-Fc-treated vs. non treated (NT) cells. Genes considered to be significantly upregulated or downregulated (log2FC ≥ 1.0/ ≤ − 1.0, FDR Q ≤ 0.05) are colored red or blue, respectively. (b) Venn diagrams showing the degree of overlap between the anti-IgM and DC-SIGN-Fc upregulated (top panel) and downregulated (bottom panel) genes. (c) Graphs show effect of DC-SIGN-Fc on genes significantly (i) induced (log2FC ≥ 1.0, FDR Q ≤ 0.05) or (ii) repressed (log2FC ≤ 1.0, FDR Q ≤ 0.05) by anti-IgM, and of anti-IgM on genes significantly (i) induced (log2FC ≥ 1.0, FDR Q ≤ 0.05) or (ii) repressed (log2FC ≤ 1.0, FDR Q ≤ 0.05) by DC-SIGN-Fc. The black lines show regression line with 95% confidence interval (grey) fitted by linear regression between the log2FC datasets. The blue dotted line is a line of equality (x = y). Results of Pearson’s correlation analysis are shown. (d) Gene set enrichment analysis (GSEA). Left panel shows NES scores for all gene sets for anti-IgM or DC-SIGN-Fc-treated FL samples, with gene sets with enrichment FDR Q < 0.01 colored as indicated. Right panel is an expanded view of the region containing positively correlated gene sets with enrichment FDR Q < 0.011 for both anti-IgM and DC-SIGN-Fc with identity of selected pathways detailed. Full details of GSEA outputs are provided in Supplementary file 2 online.

