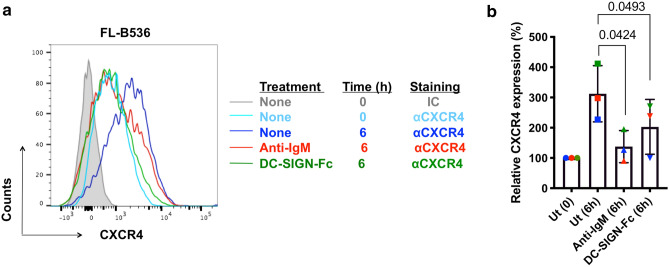
Figure 2.
Regulation of CXCR4 expression in primary FL samples. (a, b) CXCR4 expression in CD10+/CD20+ cells of FL samples FL-B536, FL-LY86 and FL-LY221 at the start of the experiment, or after 6 h of treatment with anti-IgM or DC-SIGN-Fc, or left untreated (Ut) as a control. (a) Representative results obtained using sample FL-B536 and (b) summary for all samples (n = 3) analyzed. The graph shows mean (± SD) relative CXCR4 expression with values for control cells at 0 h set to 100%. The statistical significance of the indicated differences is shown (Paired t-test).

