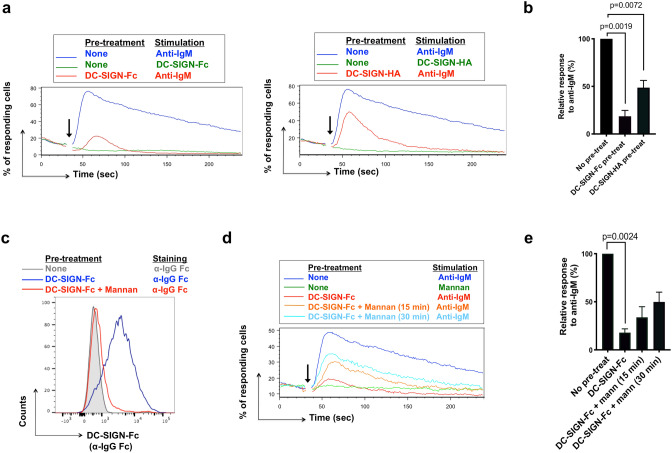
Figure 4.
Effect of DC-SIGN pre-exposure on anti-IgM-induced signaling in WSU-FSCCL cells. (a, b) Anti-IgM-induced iCa2+ flux in WSU-FSCCL cells following pre-exposure to DC-SIGN-Fc/HA. (a) Representative results for DC-SIGN-Fc (left) and DC-SIGN-HA (right) pre-treatment follow by addition (arrow) of the stimulation as stated and (b) summary of data mean for 6 (DC-SIGN-Fc) or 3 (DC-SIGN-HA) individual experiments. Graphs show mean (± SD) response with values for anti-IgM only cells set to 100%. Statistical significance of the indicated differences is shown (paired t-test). (c) DC-SIGN displacement after mannan incubation. FACS analysis of WSU-FSCCL cells left untreated (grey), incubated with DC-SIGN-Fc 30 min at 37 °C (blue) or incubated with DC-SIGN-Fc 30 min at 37 °C, washed and left 15 min with 40 μg/ml of Mannan at 37 °C (red). Cells were stained with APC Cy-7 F(ab’)2 anti-hIgG Fc (α-IgG Fc) to detect DC-SIGN-Fc binding. (d, e) Effect of pre-treatment with DC-SIGN-Fc ± mannan for 15 or 30 min at 37 °C on iCa2+ flux. (d) Representative result and (e) summary of data mean for 3 individual experiments. Graphs show mean (± SD) response with values for anti-IgM only/no pretreatment cells set to 100%. Statistical significance of the indicated differences is shown (paired t-test).

