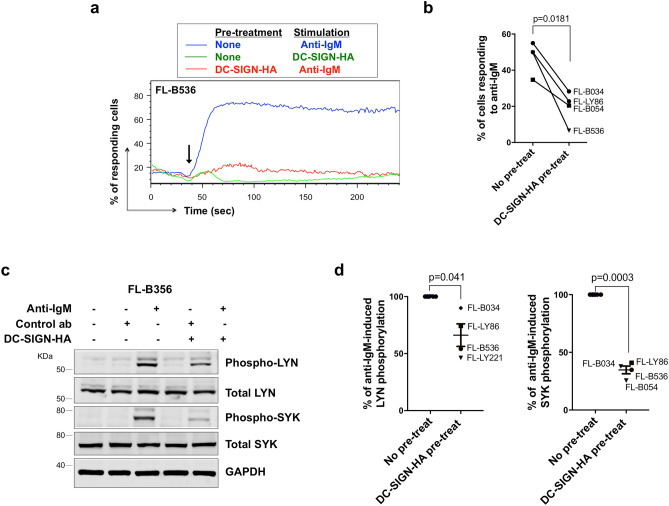
Figure 6.
Effect of DC-SIGN on anti-IgM signaling in primary FL samples. (a, b) Anti-IgM-induced iCa2+ flux in primary FL samples following pre-treatment with DC-SIGN-HA. (a) Representative results of FL-B536 pre-treated with DC-SIGN-HA follow by addition (arrow) of the stimulation as stated and (b) summary of data for 4 samples. Graphs show mean (± SD) response with values for anti-IgM only cells set to 100%. Statistical significance of the indicated differences is shown (paired t-test). (c, d) Immunoblot analysis showing effect of pre-treatment with DC-SIGN-HA on total and phosphorylated LYN and SYK expression in anti-IgM-stimulated FL cells. Cells were pre-exposed to DC-SIGN-HA for 30 min at 4 °C and then stimulated for 30 s with control antibody, DC-SIGN-HA or anti-IgM at 37 °C. GAPDH expression was analyzed as loading control. (c) Representative results (FL-B536). Gels were run under the same experimental conditions and molecular weight of proteins markers shown as KDa. Full-length blots are shown in Supplementary Fig. 5. (d) Summary of data for 4 samples. Graphs show mean (± SD) response with values for no pre-treat (ie anti-IgM treated only) cells set to 100%. The statistical significance of the indicated differences is shown (paired t-test).

