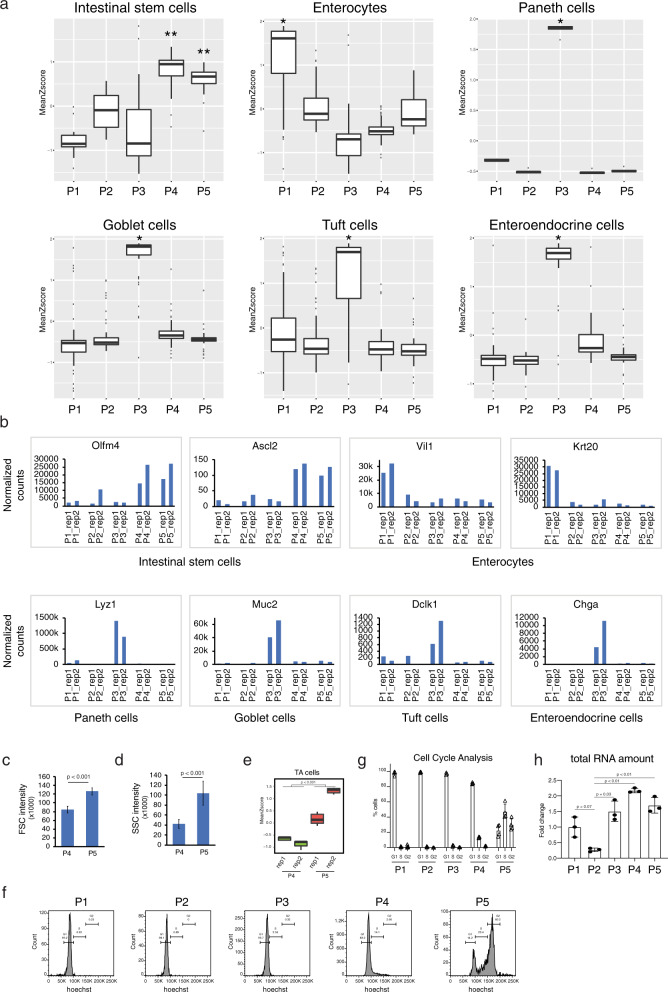
Fig. 5. Transcriptional profiling of the OSCAR intestinal cell populations.
a Box plot of geneset enrichment analysis of the indicated gene datasets in the different OSCAR cell populations. P4/P5 cell population correlates with intestinal stem cells, P1 with enterocytes and P3 with secretory cells. Boxplots shows the quartile distribution of the data. A distance of 1.5 times the inter quartile range (Q3–Q1) is measured out below the lower quartile and a whisker is drawn up to the lower observed point from the dataset that falls within this distance. All other observed points are plotted as outliers. Intestinal stem cells n = 24 genes, Enterocytes n = 108 genes, Paneth cells n = 14 genes, Goblet cells n = 91 genes, Tuft cells n = 103 genes, Entroendocrine cells n = 77 genes. Intestinal stem cells p value: P1 vs P4 = 0.0002, P2 vs P4 = 0.0001, P3 vs P4 = 0.0245, P1 vs P5 = 0.0002, P2 vs P5 = 0.0006, P3 vs P5 = 0.0352, Enterocytes p value: P1 vs P2 = 2.038104e − 08, P1 vs P3 = 2.931078e − 11, P1 vs P4 = 1.590139e − 11, P1 vs P5 = 4.872108e − 09, Paneth cells p value: P1 vs P2, P3, P4 and P5 = 0.0039, Goblet cells p value: P1 vs P3 = 1.563194e − 12, P2 vs P3 = 9.947598e − 13, P4 vs P3 = 1.791989e − 11, P5 vs P3 = 2.700062e − 13, Tuft cells p value: P1 vs P3 = 2.248624e − 06, P2 vs P3 = 3.970961e − 08, P4 vs P3 = 7.164053e − 10, P5 vs P3 = 5.493567e − 10. Entroendocrine cells p value: P1 vs P3 = 6.743903e − 10, P2 vs P3 = 2.273737e − 12, P4 vs P3 = 8.708412e − 09, P5 vs P3 = 4.547474e − 12. The p value is calculated by Wilcoxon two-tailed test. b Bar charts showing the RNAseq normalized counts levels of the indicated gene markers in the analyzed OSCAR populations. c, d Forward (FSC) and side (SSC) scatter values from the FACS analysis in the P4 and P5 OSCAR populations. FSC is directly proportional to the size of the cells, while SSC provides information about the internal cell complexity (granules and nucleus increase SSC). n = 4 mice were analyzed. Data are presented as mean value ± SD (for panel (c), p value = 0.0003 and for panel (d) p value = 0.0028). e Box plot of geneset enrichment analysis of transit-amplifying (TA) cell markers in the P4/P5 cell populations. Boxplots shows the quartile distribution of the data. A distance of 1.5 times the inter quartile range (Q3–Q1) is measured out below the lower quartile and a whisker is drawn up to the lower observed point from the dataset that falls within this distance. All other observed points are plotted as outliers. The p value is calculated by Wilcoxon two-tailed test. n = 235 gene. f Cell-cycle FACS analysis performed by using Hoechst33342 staining of the different cell populations isolated from the OSCAR mouse intestinal epithelial crypts. g Quantification of the cell-cycle FACS analysis. n = 4 mice were analyzed. Data are presented as mean value ± SD. h Bar chart indicating the relative cellular RNA content of the different cell populations isolated from the OSCAR mouse intestinal epithelial crypts. n = 3 pool of 2 mice were analyzed. Data are presented as mean value ± SD (for p4, p value = 0.0007 and for p5, p value = 0. 0.0076). Paired two-tailed t-test was used for the statistical analysis. Source data are provided as a Source Data file.

