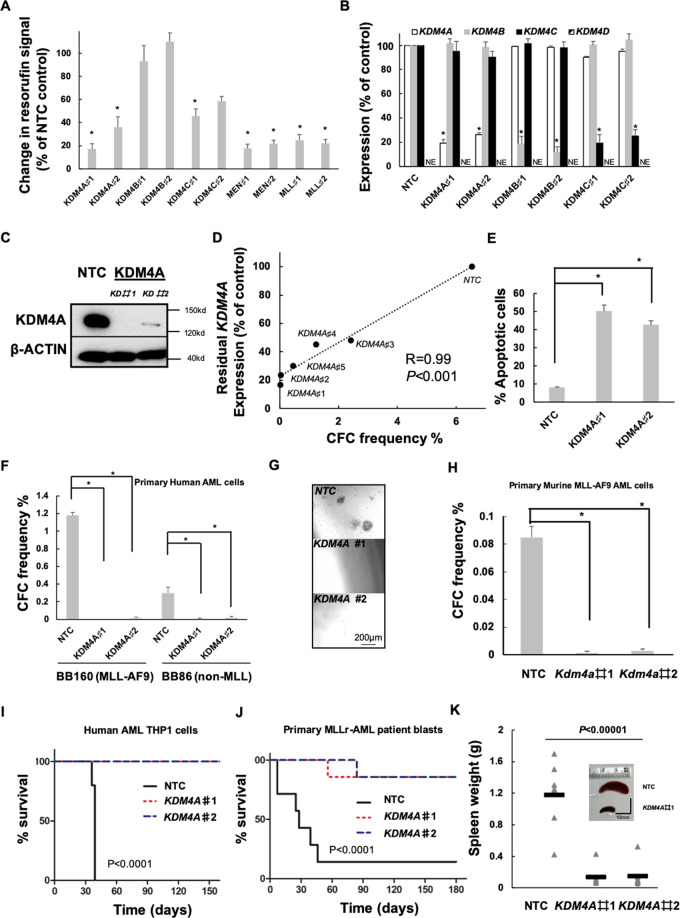
Fig. 1. KDM4A is required for the functional potential of human and murine AML cells.
A–E Human THP1 AML cells were transduced with lentiviruses targeting KDM4A or other KDM4 family members for KD (♯1 and ♯2 represent individual distinct lentiviruses targeting genes for KD as indicated), or a non-targeting control (NTC), using KD of MLL and MEN1, as positive controls, which are essential genes for AML cell proliferation. All bar charts show mean ± s.e.m. A Resorufin signal after 4 days of individual KDM4 family member KD relative to NTC control cells (n = 3); *p < 0.01 for comparison of each KD versus NTC. B Expression of KDM4A/B/C/D in indicated KD cells relative to NTC control cells (n = 3); *p < 0.001. C Representative immunoblot showing KDM4A KD in THP1 cells (n = 3). D Scatter plot shows the correlation of KDM4A KD with inhibition of frequency of colony-forming cells (CFC) enumerated following 10 days in semisolid culture (n = 3), as determined by QPCR; *p < 0.001. E Percentage of apoptotic cells determined by Annexin V+/ 7AAD+/− staining on day 4 of liquid culture after puromycin selection (n = 3); *p < 0.001. F–G The indicated primary unfractioned patient blasts were transduced with lentiviruses targeting KDM4A for KD, or an NTC. Primary AML cells used include BB160, containing t(9;11) (MLL-AF9) chromosomal translocation and BB86 (normal cytogenetics, non-MLL) (BB number is the Manchester Cancer Research Centre Biobank sample identifier). All bar charts show mean ± s.e.m. F CFC frequencies of primary human AML blasts (n = 3) following lentivirus infection, puromycin selection, and initiation of KDM4A KD; *p < 0.0001. G Representative images from F. H CFC frequencies of primary murine MLL-AF9 AML cells following KDM4A depletion (n = 3); *p < 0.0001. I Survival curves of NSG mice transplanted with 10,000 KDM4A KD or NTC THP1 cells (n = 5 per cohort); p by log-rank test. J Survival curves of NSG mice transplanted with 106 KDM4A KD or NTC primary AML cells (BB160, n = 7 per cohort); p by log-rank test. K Spleen weights of mice from J with a representative image of the spleen. p by one-way ANOVA, F = 34.13045.

