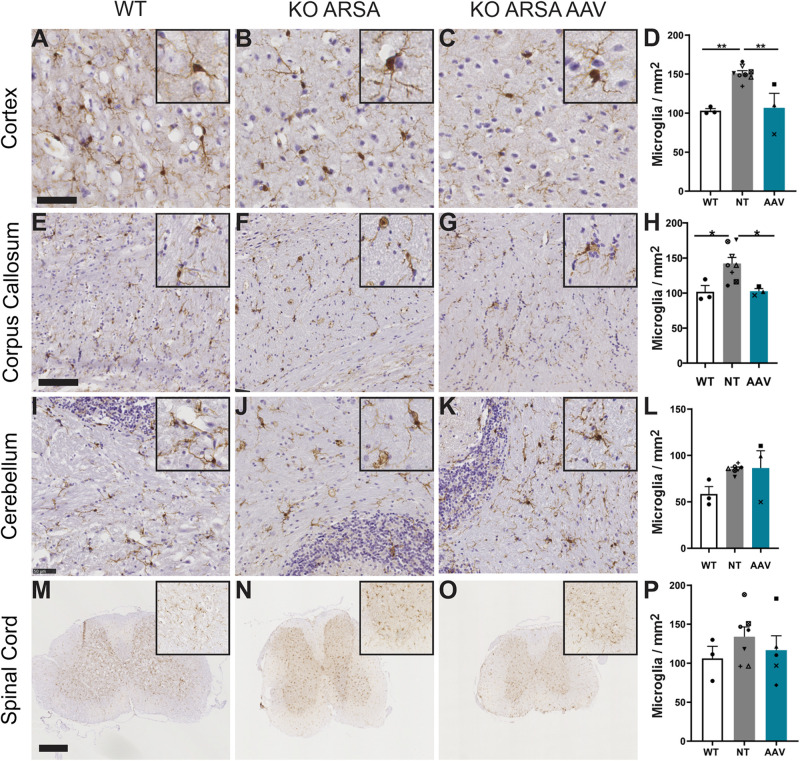
FIGURE 5.
Correction of microgliosis in cortex and corpus callosum of treated KO-ARSA mice, 3 months after treatment. (A–C,E–G,I–K,M–O) Immunohistochemistry of Iba1 in cortex (A–C), corpus callosum (E–G), cerebellum (I–K) and spinal cord (M–O) of wild-type (WT; A,E,I,M), untreated (KO ARSA; B,F,J,N) and AAVPHP.eB-hARSA-HA treated (KO ARSA AAV; C,G,K,O) KO ARSA mice. Insets are high magnification of tissue section. (D,H,L,P) Quantification of Iba1-positive cells per mm2 in cortex (D), corpus callosum (H), cerebellum (L) and spinal cord (P) of WT (n = 3), untreated (NT, n = 6–8) and treated (AAV, n = 5) KO ARSA mice. Data are represented as mean ± SEM. Scale bars: 50 μm (A–C,I–K), 100 μm (E–H), 500 μm (M–O).*p < 0.05; **p < 0.01.

