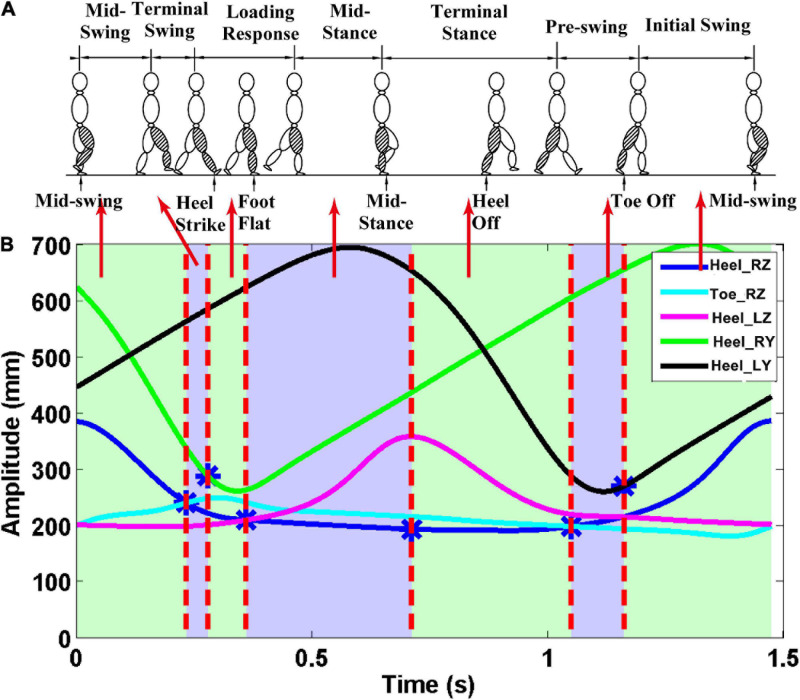
FIGURE 2.
Gait phase division results. The z-direction corresponds to the vertical direction, and the y-direction is the anteroposterior. (A) Seven gait phases of the gait cycle; (B) trajectory data. The first vertical red line—the first intersection of Heel_RZ and Toe_RZ. The second vertical red line—the point with the largest difference between Heel_RY and Heel_LY. The third vertical red line—the first intersection of the Heel_RZ and Heel_LZ. The fourth vertical red line—the maximum point of the Heel_LZ. The fifth vertical red line—the second intersection of the Heel_RZ and the Toe_RZ. Finally, the sixth vertical red line—the point with the smallest difference between the Heel_RY and the Heel_LY.

