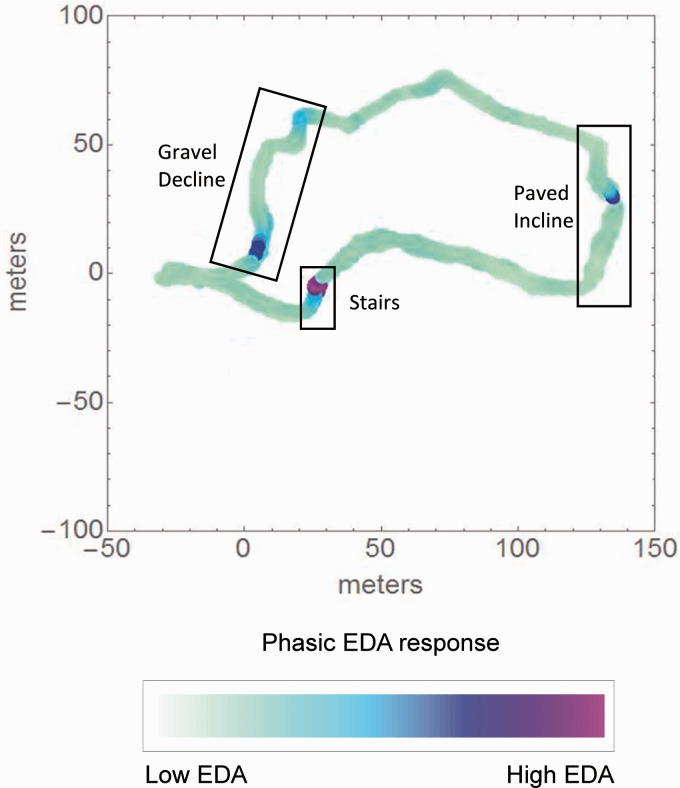
Figure 4.
Representative sample of a phasic electrodermal activation (EDA) map constructed in synchronization with coordinates from GPS signal collected over the walking course. The locations of the tasks are indicated by boxed labels on the figure. The colour gradient at yellow-green represents the lowest phasic EDA level observed in all subjects, and as the colour transforms to a more blue-purple the colour, it represents the highest phasic EDA level observed in all subjects.

