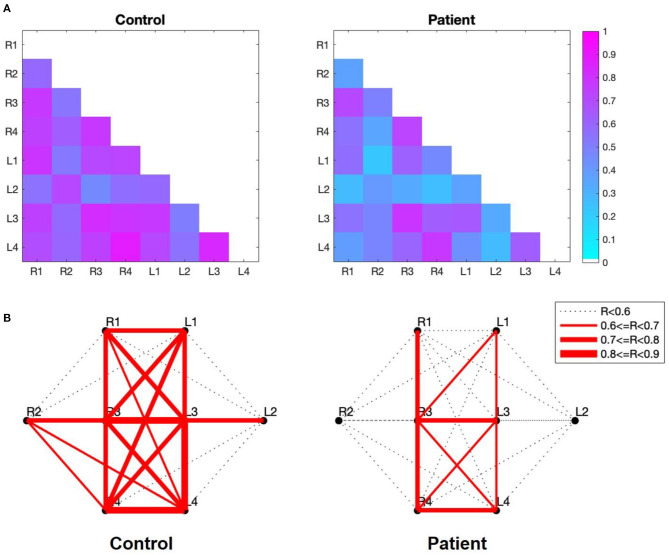
Figure 4.
(A) Correlation maps of the verbal fluency task for the two groups. The image shows the lower diagonal of the cross-correlation matrix. The rows and columns of the matrix represent the subgroup, while the cells of the matrix contain the color-coded correlation coefficient of the corresponding pair. The blue cells indicate a lower between-subgroup correlation, while higher between-subgroup correlations are indicated in magenta. (B) Subregion-based functional connectivity The line width indicates the strength of the correlation, as determined by the correlation coefficient (R) between each pair of subregions.

