Figure 1.
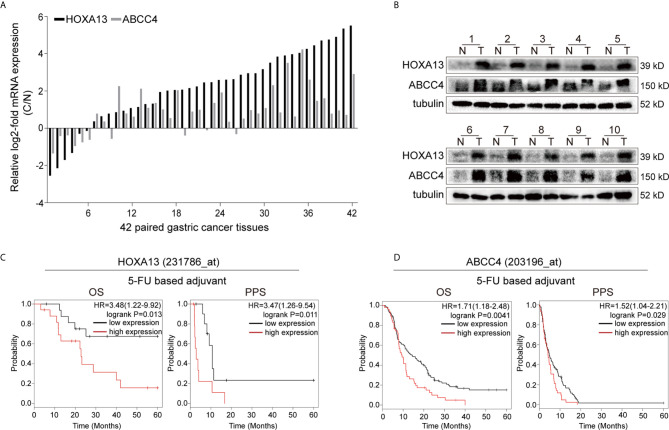
High HOXA13 expression is associated with 5-FU resistance. (A) qRT-PCR analysis of HOXA13 and ABCC4 expression in GC tissues compared with paired normal tissues. (B) Western blot analysis of HOXA13 and ABCC4 expression in GC tissues compared with paired normal tissues. (C) The Kaplan–Meier plotter showed that upregulation of HOXA13 was significantly associated with lower OS and PPS in GC patients with 5-FU treatment. (D) In 5-FU based chemotherapy, GC patients with high ABCC4 expression had poorer prognosis (http://kmplot.com/analysis/).

