Figure 4.
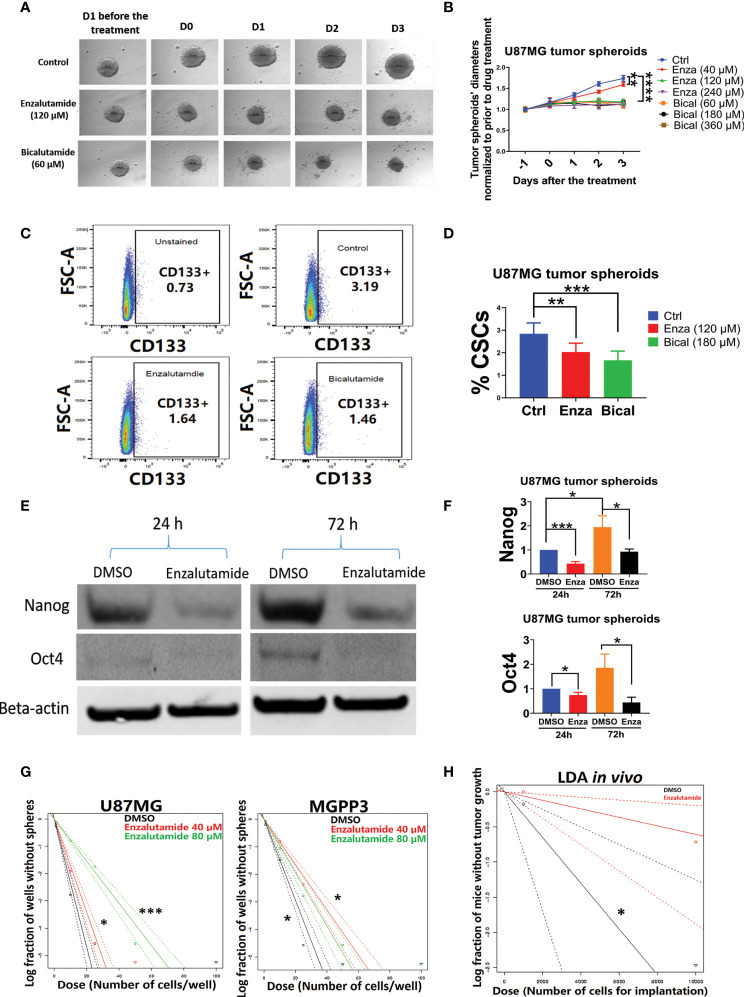
AR antagonists decrease the cancer stem cell population in U87MG GBM cells in vitro. U87MG spheroids were cultured in low serum medium (0.5%) for 2 days and then treated with DMSO (negative control), enzalutamide (120 µM), or bicalutamide (180 µM) for another 4 days with diameters of spheroids measured daily. (A) Representative figures of the U87MG spheroids before and after the treatment of enzalutamide (120 µM) or bicalutamide (60 µM). (B) Measured diameters of the spheroids normalized to before the treatment during drug treatment with increasing concentrations of enzalutamide (40, 120, and 240 µM) or bicalutamide (60, 180, and 360 µM). (C) Representative flow cytometry gating strategy with dissociated cells from U87MG spheroids. Upper left: no drug treatment and no CD133 antibody staining; upper right: DMSO only (no drug treatment control); lower left: enzalutamide (120 µM); lower right: bicalutamide (180 µM). (D) CSC populations (CD133+) were compared in dissociated cells from spheroids with or without treatment of AR antagonists using flow cytometry as shown in (C) Eight replicates per group were used for flow cytometry with mean values presented in the histogram. (E) Western blotting assays showed decreased expression levels of CSC markers, Nanog and Oct4, after enzalutamide treatment for 24 and 72 h. (F) Quantification of Nanog and Oct4 protein levels before and after the treatment of enzalutamide for 24 and 72 h. All experiments were performed with three independent replicates. (G) Extreme Limiting Dilution Assays (ELDA) in vitro to estimate the frequency of tumor sphere-forming stem-like cells in U87MG and MGPP3 cell lines. Plot of the log (e) fraction of wells without tumor spheres as a function of plated U87MG/MGPP3 cell number/well. The more vertical the line, the higher the percentage of tumor sphere-forming cells or CSCs. (H) Extreme Limiting Dilution Assays (ELDA) in vivo to estimate the frequency of CSCs. Plot of the log (e) fraction of mice without tumor growth as a function of implanted MGPP3 cells. *p < 0.05; **p < 0.01; ***p < 0.001; ****p < 0.0001.

