Figure 7.
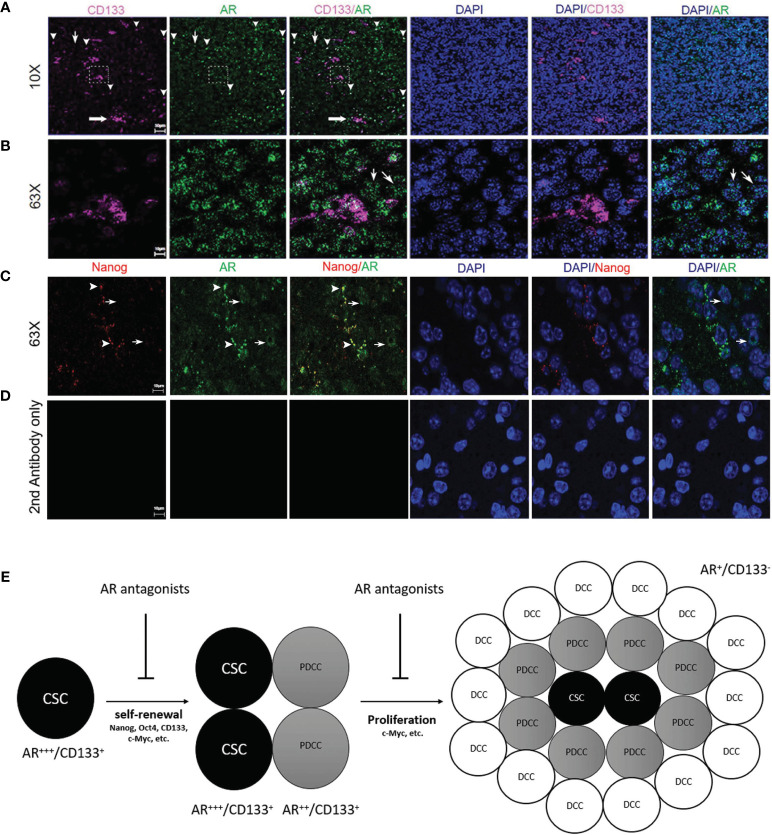
Immunofluorescence confocal microscopy on mouse GBM FFPE specimen (5 µm thickness) showing the subcellular localizations of AR (green), CD133 (pink) and DAPI-stained nuclei (blue). (A) Low magnification images (10×) and (B) high magnification images (63×) which were scanned from areas in the dash line boxes in (A) demonstrated co-expression of CD133 in AR-expressing (AR+) cells with high staining intensity (arrowheads). AR expression can be seen in CD133 negative cells but with low AR staining intensity (thin arrows). (C) High magnification images (63×) demonstrated co-expression of Nanog in AR+ cells with high AR staining intensity (arrowheads). Cells with negative Nanog staining could be AR+ but showed weaker AR staining intensities than Nanog+ cells (thin arrows). (D) High magnification images (63×) with slides stained with secondary antibodies only as negative controls. (E) Schematic figure showing the proposed mechanisms of AR antagonists inhibiting both cancer stem cells maintenance and cancer proliferation from more differentiated cells. CSC, cancer stem cell; PDCC, partially differentiated cancer cell; DCC, differentiated cancer cell.

