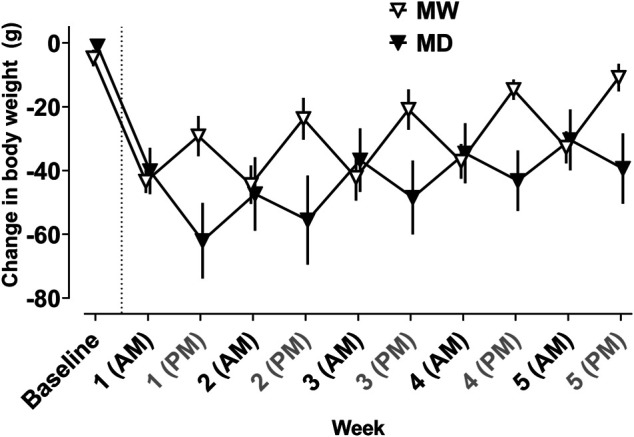
FIGURE 1.

Average change in body weight (g) from baseline weight measured every 12 h in the 12 h (MD) and 20 h (MW) deprivation groups. The dotted line represents induction of dependence. All self-administration sessions occurred at AM time points. The MW group received morphine at AM time points and the MD group received morphine at PM time points. Data represent the mean (±SEM), and each point represents six to eight rats.
