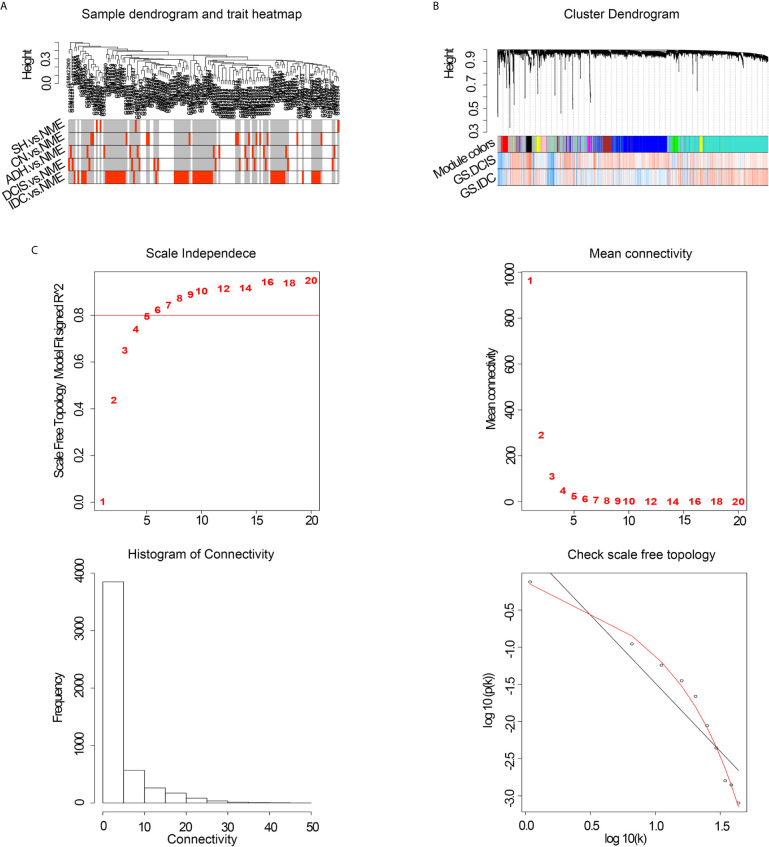
Figure 1.
(A) Cluster tree of breast cancer samples. (B) Analysis of network topology of various soft-thresholding powers. NME, normal mammary epithelium; SH, simple ductal hyperplasia; CN, cancer normal; ADH, atypical ductal hyperplasia; DCIS, ductal carcinoma in situ; IDC, invasive ductal carcinoma; GS, gene significance. (C) Hierarchical cluster analysis dendrogram. The gene clustering tree was obtained via hierarchical clustering of adjacency-based dissimilarity.

