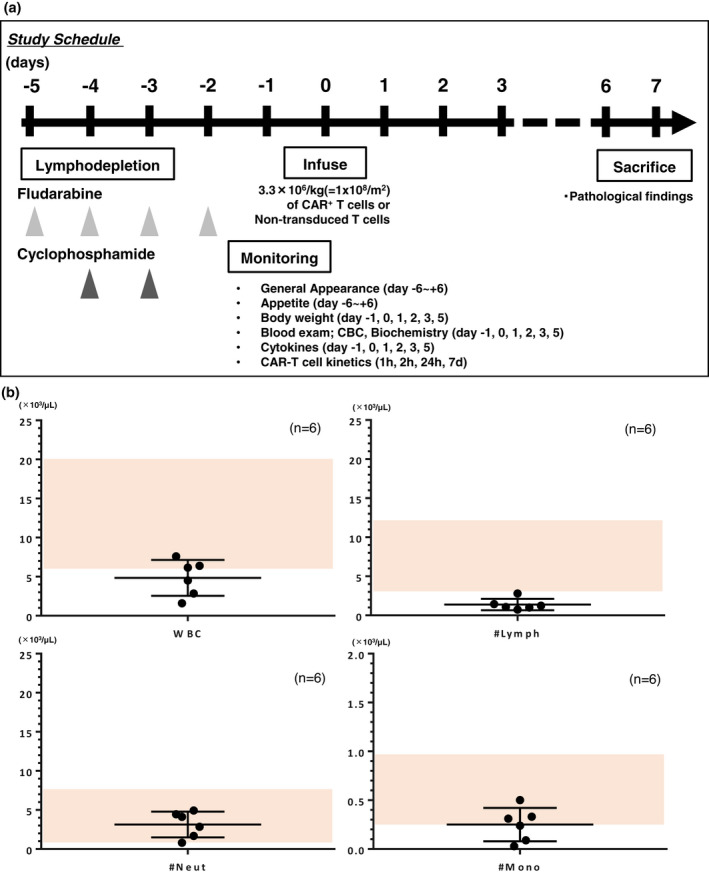
Figure 1.

Treatment overview and whole‐blood cell monitoring. (a) Treatment overview. (b) Whole‐blood cell count on day −1 of T‐cell infusion. The absolute number of total white blood cells, lymphocytes, neutrophils and monocytes of each macaque (n = 6) was plotted with mean ± SD. A shaded area represents the normal limits of each parameter.
