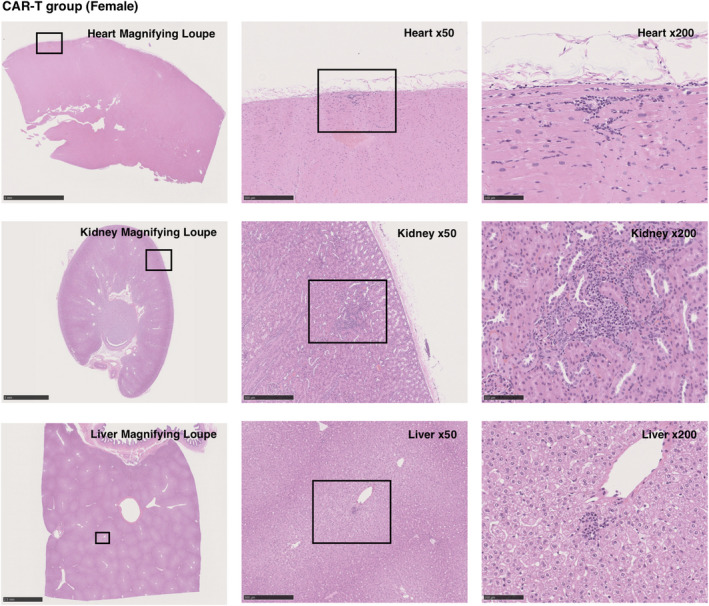
Figure 6.

Histological analysis of the CAR‐T group. Representative images of haematoxylin and eosin staining are shown. There were no microscopic changes in the liver, gall bladder, kidney, spleen, heart, brain and thoracic spinal cord because of CAR‐T cell infusion, although markedly few numbers of infiltrating mononuclear cells were detected in the liver, kidney and heart.
