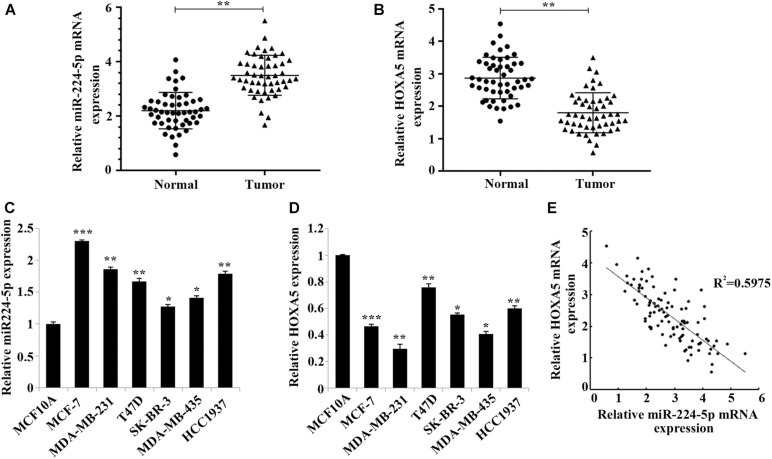
FIGURE 1.
Negative correlation between miR-224-5p and HOXA5 expression in breast cancer. (A,B) RT-qPCR-based detection of miR-224-5p expression and HOXA5 expression in breast cancer tissues and non-tumor adjacent tissues; **P < 0.01 vs. normal group. (C,D) RT-qPCR-based detection of miR-224-5p expression and HOXA5 expression in human breast epithelial cells MCF10A and human breast cancer cell lines MCF-7, MDA-MB-231, T47D, SK-BR-3, MDA-MB-435, and HCC1937; *P < 0.05, **P < 0.01 and ***P < 0.001 vs. MCF10A group. (E) Pearson correlation analysis between the expression of miR-224-5p and HOXA5.

