
Fig. 1.
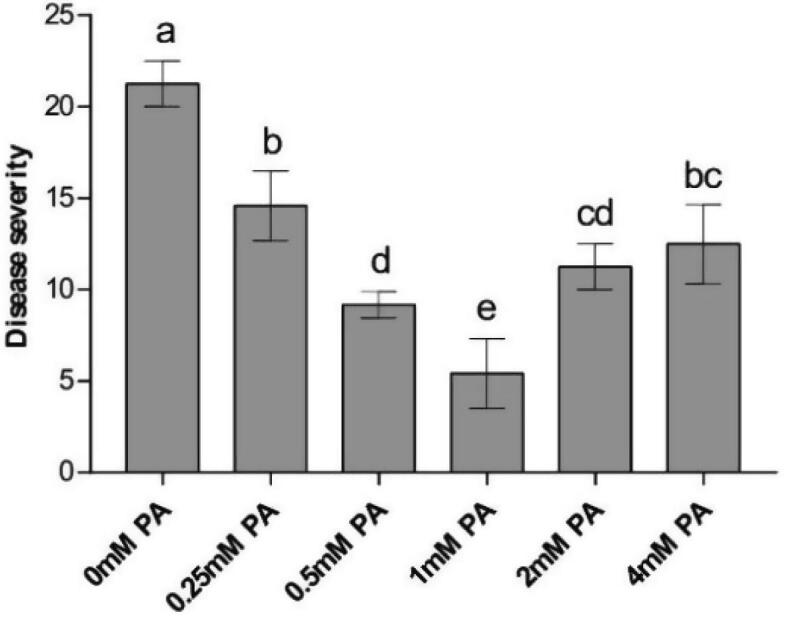
Effects of PA on the disease severity in watermelon. Letters indicate values (means ± SE, n = 3) with significant differences within the same group (P < 0.05, Duncan’s multiple range test).
Official websites use .gov
A
.gov website belongs to an official
government organization in the United States.
Secure .gov websites use HTTPS
A lock (
) or https:// means you've safely
connected to the .gov website. Share sensitive
information only on official, secure websites.
Effects of PA on the disease severity in watermelon. Letters indicate values (means ± SE, n = 3) with significant differences within the same group (P < 0.05, Duncan’s multiple range test).