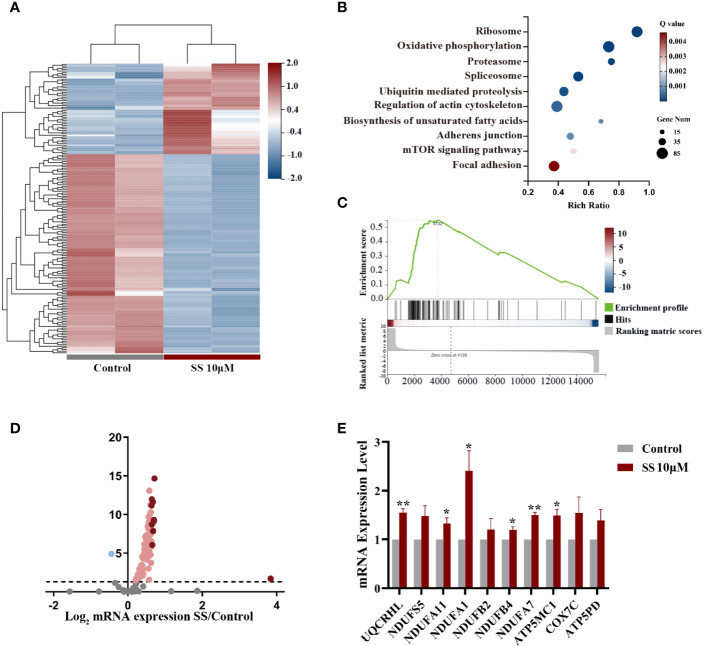
Figure 3.
Gene expression analysis in thyroid cancer cells treated with SS. (A) Heatmap of differentially expressed genes between the SS and control groups. (B) Pathway enrichment analysis showing the top 10 changed pathways after SS treatment. (C) Single-sample gene set enrichment analysis (ssGSEA) was used to obtain the enrichment score of the oxidative phosphorylation pathway. (D) Volcano plot of genes enriched in the oxidative phosphorylation pathway (OXPHOS). (E) Relative RNA expression of the top 10 genes enriched in OXPHOS was validated by qRT-PCR in KHM-5M cells. SS, sodium selenite. *P < 0.05; **P < 0.01.

