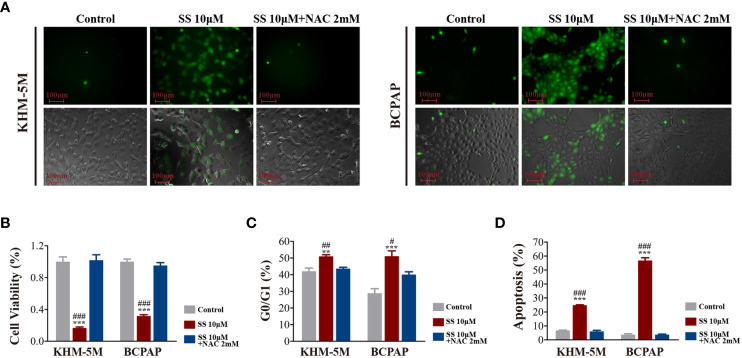
Figure 4.
SS induced ROS in thyroid cancer cells. (A) Intracellular ROS levels detected by the ROS-sensitive fluorescent dye dichlorofluorescein diacetate (DCFH-DA) after incubation with SS or SS+NAC (2 mM) for 6 h. (B) Cell viability based on CCK8 assays, (C) cell cycle distribution based on flow cytometry, (D) apoptosis based on flow cytometry were detected after incubation with SS, PBS (control), or SS+NAC (2 mM) for 24 h. Data are expressed as mean ± SD. **P < 0.01; ***P < 0.001 vs control; #P < 0.05; ##P <0.01; ###P < 0.001 vs SS+NAC group. SS, sodium selenite; NAC, N-acetylcysteine.

